KDJ Indicator For ThinkOrSwim

horserider

Well-known member
VIP
KDJ Indicator For ThinkOrSwim
@Chaomane This is most likely similiar to your trading view one. Thought I had seen it before and had it in my records.

Code:
#

declare lower;

input overBot       = 80;
input overSld       = 20;
input kPeriod       = 9;
input dPeriod       = 3;
input slowingPeriod = 3;
input averageType   = AverageType.SIMPLE;

def rsv             = StochasticFull( overBot, overSld, kPeriod, dPeriod, high, low, close, slowingPeriod, averageType ).FastK;

plot K              = MovingAverage( averageType, rsv, slowingPeriod );
plot D              = MovingAverage( averageType, K, dPeriod );
plot J              = ( 3 * D ) - ( 2 * K );

plot OverBought     = overBot;
plot OverSold       = overSld;

K.SetDefaultColor( GetColor( 1 ) );
D.SetDefaultColor( GetColor( 6 ) );
J.SetDefaultColor( GetColor( 5 ) );

OverBought.SetDefaultColor( Color.BLACK );
OverSold.SetDefaultColor( Color.BLACK );
 
Last edited by a moderator:
Guys, the previous and your post here, I try to use the KDJ script 3 of them all showing different value in the J line. BECAREFUL on the wrong code.
I found this on the original thinkorswim website, the TOS script original script provided by TDAmeritrade , you can click to import.

Open shared thinkScript Study in thinkorswim
https://tos.mx/vfkOQrD
Ruby:
declare lower;


input KPeriod = 9;
input DPeriod = 3;
input priceH = high;
input priceL = low;
input priceC = close;
input slowing_period = 3;
input averageType = AverageType.Exponential;

def lowest_k = Lowest(priceL, KPeriod);
def c1 = priceC - lowest_k;
def c2 = Highest(priceH, KPeriod) - lowest_k;
def FastK = if c2 != 0 then c1 / c2 * 100 else 0;

plot FullK = MovingAverage(averageType, FastK, slowing_period);
plot FullD = MovingAverage(averageType, FullK, DPeriod);
plot FullJ = (3 * FullD) - (2 * FullK);

FullK.SetdefaultColor(Color.Blue);
FullD.SetDefaultColor(Color.Red);
FullJ.SetDefaultColor(Color.Green);
 
Last edited by a moderator:
Hi, I wrote another version of KDJ indicator which based on difference sequence & linear combination insdead. The definition of RSV is exactly the same, the initial value of K and D is 50, insread of moving average, K(i)=((kPeriod-1)/kPeriod)*K(i-1)+(1/kPeriod)*RSV(i), the calculation of D(i) is similar, J=3*K-2*D. This calculation method is exactly the same as the KDJ indicator provided by many Asian brokerages like webull(微牛) and Futu(富途).
Code:
declare lower;

input rsvPeriod     = 9;
input kPeriod       = 3;
input dPeriod       = 3;
input overBot       = 80;
input overSld       = 20;
input averageType   = AverageType.SIMPLE;

def rsv = ((close - Lowest(low, rsvPeriod)) / (Highest(high, rsvPeriod) - Lowest(low, rsvPeriod))) * 100;
def K_;
def D_;
if K_[1] {
    K_ = ((kPeriod - 1) / kPeriod) * K_[1] + (rsv / kPeriod);
} else {
    K_ = 50;
}
if D_[1] {
    D_ = ((dPeriod - 1) / dPeriod) * D_[1] + (K_ / dPeriod);
} else {
    D_ = 50;
}

plot K = K_;
plot D = D_;
plot J = (3 * K - 2 * D);
plot OverBought     = overBot;
plot OverSold       = overSld;

K.SetDefaultColor( Color.WHITE );
D.SetDefaultColor( Color.YELLOW );
J.SetDefaultColor( Color.MAGENTA );
OverBought.SetDefaultColor( Color.RED );
OverSold.SetDefaultColor( Color.GREEN );
oh my god! you save my life! this is exactly I want and the same as the XQ Taiwan APPS, I been looking for this for long time, I was using the TD script and all other post here for the script all wrong value. THIS IS LIFE SAVING! I hope they don't use the wrong code for the KDJ!

BECAREFUL GUYS I lost money cause of the WRONG KDJ script - the J -value, please pay attention.

I compare the AXSM - 5 min chart, - 3/14/2022/ 3:55PM , last candle bar! J value is 103% in XQ APPS, and your code in TD showing the same 103%
 
Last edited by a moderator:
Code:
declare lower;

input RangeLength = 14;
input JsmoothLength = 3;
input KsmoothLength = 3;
input DsmoothLength = 3;

def RSV = (close - lowest(low, RangeLength)) / (highest(high, RangeLength) - lowest(low, RangeLength)) * 100;
def K = (2 / 3) * K[1] + (1 / 3) * RSV;
def D = (2 / 3) * D[1] + ( 1 / 3 ) * K;

plot J = Average(3 * K - 2 * D, JsmoothLength);
plot K_Smoothed = Average(K, KsmoothLength);
plot D_Smoothed = Average(D, DSmoothLength);
plot ob = 80;
plot os = 20;
plot ml = 50;

# SIGNALS
plot c = 100;
plot zero = 0;
plot Buy = if J crosses above 0 then 0 else double.nan;
plot Sell =  if J crosses below 100 then 100 else double.nan;
buy.setPaintingStrategy(PaintingStrategy.ARROW_UP);
sell.setPaintingStrategy(PaintingStrategy.ARROW_DOWN);

or something like that. I didn't try to do colors or line styles. you may add that or change them through the UI to your tastes.

-mashume

EDITED to add the buy and sell signals from the TradeView indicator. Don't know if they will ever trigger or not.
 
Last edited:
Code:
declare lower;

input RangeLength = 14;
input JsmoothLength = 3;
input KsmoothLength = 3;
input DsmoothLength = 3;

def RSV = (close - lowest(low, RangeLength)) / (highest(high, RangeLength) - lowest(low, RangeLength)) * 100;
def K = (2 / 3) * K[1] + (1 / 3) * RSV;
def D = (2 / 3) * D[1] + ( 1 / 3 ) * K;

plot J = Average(3 * K - 2 * D, JsmoothLength);
plot K_Smoothed = Average(K, KsmoothLength);
plot D_Smoothed = Average(D, DSmoothLength);
plot ob = 80;
plot os = 20;
plot ml = 50;

# SIGNALS
plot c = 100;
plot zero = 0;
plot Buy = if J crosses above 0 then 0 else double.nan;
plot Sell =  if J crosses below 100 then 100 else double.nan;
buy.setPaintingStrategy(PaintingStrategy.ARROW_UP);
sell.setPaintingStrategy(PaintingStrategy.ARROW_DOWN);

or something like that. I didn't try to do colors or line styles. you may add that or change them through the UI to your tastes.

-mashume

EDITED to add the buy and sell signals from the TradeView indicator. Don't know if they will ever trigger or not.
thank you for helping out, but why is that only 2 line? there is no J line.
 
thank you for helping out, but why is that only 2 line? there is no J line.
I dunno... on my screen I've got three moving lines and five static levels. Seems to work (at least on whatever ticker was on my screen when I popped this one on).

-mashume
 
Can someone please make this KDJ calculation into think script?

Calculation formula

RSV=(CLOSE-LLV(lOW,N1))/(HHV(HIGH,N1)-LLV(LOW,N1))*100

K=MA(RSV, N2)

D=MA(K,N3)

J=3*K-2*D

Where N1=9, N2=3, N3=3

The K and D values ??are always between 0 and 1.

The RSV in the KD line varies with the high and low prices on the 9th and the closing price. If the market is a clear uptrend, it will drive the K line (fast average) and the D line (slow average) to rise. However, if the rally starts to slow down, it will slowly react to the K and D values, causing the K line to fall below the D line, at which point the short-term downtrend is established. Since the KD line is essentially a concept of random fluctuations, it is very correct for the short- and medium-term market.

By default, the system draws three lines on the sub-picture, which are the three-day average line K of the RSV value, the three-day average line D of the K value, and the J line obtained by subtracting twice the value of D from the K value.

Application rule

1.When the D% value is above 70, the market is overbought. When the D% value is below 30, the market is oversold.

2.When the inclination of the K% line tends to be gentle, it is a warning signal.

3.When the K% value is greater than the D% value, it shows that the current trend is rising, so when the K% breaks through the D% line on the graph, it is the buy signal.

4.When the D% value is greater than the K% value, it shows that the current trend is to fall, so the K% in the graph falls below the D% line, which is the sell signal.

5.The intersection of the K% line and the D% line must be below 80, and the signal below 20 is more correct. The K% and D% lines are the same as the strength and weakness indicators. When the K% value and the D% value are above 70, the overbought phenomenon has been shown, and oversold phenomenon occurs below 30%. Only the strong and weak indicators can not clearly show the timing of buying and selling, and the KD line can achieve this goal.

6.When the deviation signal is generated, it is also a very correct time to buy and sell.

7.The circulation is too small, the stocks with too small trading volume are not suitable for KD indicators; the weighted index and the hot large stocks are extremely accurate.

8.When the KD value crosses around 50 and is the board, this indicator cannot be regarded as an obvious trading signal.

9.J%>100 is overbought, J%<10 is oversold, and the response is faster than K% and D%. The KD indicator is a settable calculation period (ie, n value) obtained by calculating the purchase and sale over n days, plus the average line concept, and P1, P2, and P3 values. Generally, P1 and P2 are set to 3. If P3 is set to 0, it means that the J line is not drawn.

Also this calculation please:

RSV:=(CLOSE-LLV(LOW,P1))/(HHV(HIGH,P1)-LLV(LOW,P1))*100;

K:SMA(RSV,P2,1),COLORFF8D1E;

D:SMA(K,P3,1),COLOR0CAEE6;

J:3*K-2*D,COLORE970DC;
 
Can someone please make this KDJ calculation into think script?


Also this calculation please:
It is not possible to convert snippets of pinescript to thinkscript.
There are too many undefined variables for a member to attempt a conversion
 
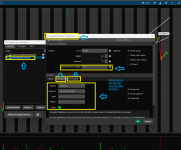
For some reason, I cannot customize this in "scan" tab. I don't know how to fix it where it shows the inputs. If someone can look into this, it would be appreciated.

This is what I am talking about.

3xi7kkvznHZX.png


Code:
#KDJ V1.0
#
#CHANGELOG
# 2020.04.29 V1.0 [USER=258]@diazlaz[/USER] Initial Port/interpretation
#
#CREDITS
#ll21LAMBOS21
#
#LINKS
#[URL]https://www.tradingview.com/script/I8oFH8LA-KDJ/[/URL]
#
#
declare lower;
#INPUTS
input ilong = 9;
input isig = 3;
input overBought = 80;
input overSold = 20;
input showColorBars = yes;

#CORE
DefineGlobalColor("cpK", CreateColor(30, 136, 229));
DefineGlobalColor("cPD", CreateColor(255, 111, 0));
DefineGlobalColor("cPJ", Color.YELLOW);

def c = close;
def h = Highest(high, ilong);
def l = Lowest(low, ilong);

def RSV = 100 * ((c - l) / (h - l));
def pK = ( 1 * RSV + (isig - 1) * pK[1]) / isig;
def pD = (1 * pK + (isig - 1) * pD[1]) / isig;
def pJ = 3 * pK - 2 * pD;

#PLOTS
AddLabel (1, "KDJ Indicator", COLOR.ORANGE);

plot ppK = pK;
ppK.SetDefaultColor(GlobalColor("cpK"));

plot ppD = pD;
ppD.SetDefaultColor(GlobalColor("cpD"));

plot ppJ = pJ;
ppJ.SetDefaultColor(GlobalColor("cpJ"));

plot pOverBought = overBought;
plot pOverSold = overSold;
pOverBought.SetDefaultColor(GetColor(3));
pOverSold.SetDefaultColor(GetColor(3));

#COLORBARS
def cR = If(pJ >= pD,Double.NaN,0);
AddCloud(data1 = 1, data2 = 100, color1 = Color.UPTICK, color2 = Color.UPTICK);
AddCloud(cR, 100,  Color.DOWNTICK, Color.DOWNTICK);

#BUY SELL ARROW
plot ppJ_crossUP = if ppJ [1] crosses above OverSold then OverSold else double.NaN ;
plot ppJ_crossDN = if ppJ [1] crosses below OverBought then OverBought else double.NaN ;

ppJ_crossUP.SetPaintingStrategy(PaintingStrategy.ARROW_up);
ppJ_crossUP.SetLineWeight(2);
ppJ_crossUP.SetDefaultColor(color.green) ;
ppJ_crossDN.SetPaintingStrategy(PaintingStrategy.ARROW_DOWN);
ppJ_crossDN.SetLineWeight(2);
ppJ_crossDN.SetDefaultColor(color.red) ;

Alert(ppJ_crossUP , "ppJ_crossUP ", Alert.Bar, Sound.Chimes);
Alert(ppJ_crossDN  , "ppJ_crossDN ", Alert.Bar, Sound.bell);

ppJ.assignValueColor(if ppJ > ppJ [1] then color.yellow else color.red);
 
For some reason, I cannot customize this in "scan" tab. I don't know how to fix it where it shows the inputs. If someone can look into this, it would be appreciated.

This is what I am talking about.
Don't really know.
The canned response from ToS support would be that scripts used in the scan hacker should only contain that logic required to define the filter.

Here is a scanned version with all extraneous formatting statements removed:
Shared Scan Link: http://tos.mx/Fnt9epX Click here for --> Easiest way to load shared links
28JnWeR.png

Ruby:
#KDJ V1.0
# 2020.04.29 V1.0 [USER=258]@diazlaz[/USER] Initial Port/interpretation
#INPUTS
input ilong = 9;
input isig = 3;
input overBought = 80;
input overSold = 20;
input showColorBars = yes;

def c = close;
def h = Highest(high, ilong);
def l = Lowest(low, ilong);

def RSV = 100 * ((c - l) / (h - l));
def pK = ( 1 * RSV + (isig - 1) * pK[1]) / isig;
def pD = (1 * pK + (isig - 1) * pD[1]) / isig;
def pJ = 3 * pK - 2 * pD;

def ppK = pK;
def ppD = pD;
def ppJ = pJ;
def pOverBought = overBought;

plot ppJ_crossUP = if ppJ [1] crosses above OverSold then OverSold else double.NaN ;
#plot ppJ_crossDN = if ppJ [1] crosses below OverBought then OverBought else double.NaN ;
This is very kind of you! Truly appreciate it!
 
Hi guys, why my code is not showing anything?

Code:
declare lower;

input P1 = 14;
input P2 = 3;
input P3 = 3;

def RSV = ((close - low(period = P1)) / (high(period = P1) - low(period = P1))) * 100;
def K = SimpleMovingAvg(RSV, P2);
def D = SimpleMovingAvg(K, P3);
def J = 3 * K - 2 * D;

AssignBackgroundColor(if J > D then Color.GREEN else Color.RED);

plot KLine = K;
KLine.SetDefaultColor(Color.ORANGE);

plot DLine = D;
DLine.SetDefaultColor(Color.BLUE);

plot JLine = J;
JLine.SetDefaultColor(Color.YELLOW);
 
Last edited by a moderator:
Hi guys, why my code is not showing anything?

Code:
declare lower;

input P1 = 14;
input P2 = 3;
input P3 = 3;

def RSV = ((close - low(period = P1)) / (high(period = P1) - low(period = P1))) * 100;
def K = SimpleMovingAvg(RSV, P2);
def D = SimpleMovingAvg(K, P3);
def J = 3 * K - 2 * D;

AssignBackgroundColor(if J > D then Color.GREEN else Color.RED);

plot KLine = K;
KLine.SetDefaultColor(Color.ORANGE);

plot DLine = D;
DLine.SetDefaultColor(Color.BLUE);

plot JLine = J;
JLine.SetDefaultColor(Color.YELLOW);

you are using low() incorrectly.
you setting period = a number, instead of a 2nd aggregation time.

https://tlc.thinkorswim.com/center/reference/thinkScript/Functions/Fundamentals/low
 
Last edited by a moderator:
Hi guys, please help to modify this KDJ code
https://usethinkscript.com/threads/kdj-indicator-for-thinkorswim.9501/
to look like original TOS = Stochastic-FULL with BREAKOUT SIGNAL. Please see photo. Need items to be changeable.

Screenshot 2023-12-20 140013.KDJ.modify.png


Code:
declare lower;


input rsvPeriod     = 9;
input kPeriod       = 3;
input dPeriod       = 3;
input overBot       = 80;
input overSld       = 20;
input averageType   = AverageType.SIMPLE;


def rsv = ((close - Lowest(low, rsvPeriod)) / (Highest(high, rsvPeriod) - Lowest(low, rsvPeriod))) * 100;
def K_;
def D_;
if K_[1] {
    K_ = ((kPeriod - 1) / kPeriod) * K_[1] + (rsv / kPeriod);
} else {
    K_ = 50;
}
if D_[1] {
    D_ = ((dPeriod - 1) / dPeriod) * D_[1] + (K_ / dPeriod);
} else {
    D_ = 50;
}


plot K = K_;
plot D = D_;
plot J = (3 * K - 2 * D);
plot OverBought     = overBot;
plot OverSold       = overSld;


K.SetDefaultColor( Color.WHITE );
D.SetDefaultColor( Color.YELLOW );
J.SetDefaultColor( Color.MAGENTA );
OverBought.SetDefaultColor( Color.RED );
OverSold.SetDefaultColor( Color.GREEN );
 
Hi guys, please help to modify this KDJ code
https://usethinkscript.com/threads/kdj-indicator-for-thinkorswim.9501/
to look like original TOS = Stochastic-FULL with BREAKOUT SIGNAL. Please see photo. Need items to be changeable.

View attachment 20467

Code:
declare lower;


input rsvPeriod     = 9;
input kPeriod       = 3;
input dPeriod       = 3;
input overBot       = 80;
input overSld       = 20;
input averageType   = AverageType.SIMPLE;


def rsv = ((close - Lowest(low, rsvPeriod)) / (Highest(high, rsvPeriod) - Lowest(low, rsvPeriod))) * 100;
def K_;
def D_;
if K_[1] {
    K_ = ((kPeriod - 1) / kPeriod) * K_[1] + (rsv / kPeriod);
} else {
    K_ = 50;
}
if D_[1] {
    D_ = ((dPeriod - 1) / dPeriod) * D_[1] + (K_ / dPeriod);
} else {
    D_ = 50;
}


plot K = K_;
plot D = D_;
plot J = (3 * K - 2 * D);
plot OverBought     = overBot;
plot OverSold       = overSld;


K.SetDefaultColor( Color.WHITE );
D.SetDefaultColor( Color.YELLOW );
J.SetDefaultColor( Color.MAGENTA );
OverBought.SetDefaultColor( Color.RED );
OverSold.SetDefaultColor( Color.GREEN );

Added the requested breakout code, replacing within it, your K and D instead of FullK and FullD as folllows:

Screenshot 2023-12-20 133900.png
Code:
declare lower;


input rsvPeriod     = 9;
input kPeriod       = 3;
input dPeriod       = 3;
input overBot       = 80;
input overSld       = 20;
input averageType   = AverageType.SIMPLE;

def rsv = ((close - Lowest(low, rsvPeriod)) / (Highest(high, rsvPeriod) - Lowest(low, rsvPeriod))) * 100;
def K_;
def D_;
if K_[1] {
    K_ = ((kPeriod - 1) / kPeriod) * K_[1] + (rsv / kPeriod);
} else {
    K_ = 50;
}
if D_[1] {
    D_ = ((dPeriod - 1) / dPeriod) * D_[1] + (K_ / dPeriod);
} else {
    D_ = 50;
}


plot K = K_;
plot D = D_;
plot J = (3 * K - 2 * D);
plot OverBought     = overBot;
plot OverSold       = overSld;


K.SetDefaultColor( Color.WHITE );
D.SetDefaultColor( Color.YELLOW );
J.SetDefaultColor( Color.MAGENTA );
OverBought.SetDefaultColor( Color.RED );
OverSold.SetDefaultColor( Color.GREEN );

###
input showBreakoutSignals = {"No", default "On FullK", "On FullD", "On FullK & FullD"};

def upK = K crosses above OverSold;
def upD = D crosses above OverSold;
def downK = K crosses below OverBought;
def downD = D crosses below OverBought;

plot UpSignal;
plot DownSignal;
switch (showBreakoutSignals) {
case "No":
    UpSignal = Double.NaN;
    DownSignal = Double.NaN;
case "On FullK":
    UpSignal = if upK then OverSold else Double.NaN;
    DownSignal = if downK then OverBought else Double.NaN;
case "On FullD":
    UpSignal = if upD then OverSold else Double.NaN;
    DownSignal = if downD then OverBought else Double.NaN;
case "On FullK & FullD":
    UpSignal = if upK or upD then OverSold else Double.NaN;
    DownSignal = if downK or downD then OverBought else Double.NaN;
}

UpSignal.SetHiding(showBreakoutSignals == showBreakoutSignals."No");
DownSignal.SetHiding(showBreakoutSignals == showBreakoutSignals."No");

OverBought.SetDefaultColor(GetColor(1));
OverSold.SetDefaultColor(GetColor(1));
UpSignal.SetDefaultColor(Color.UPTICK);
UpSignal.SetPaintingStrategy(PaintingStrategy.ARROW_UP);
DownSignal.SetDefaultColor(Color.DOWNTICK);
DownSignal.SetPaintingStrategy(PaintingStrategy.ARROW_DOWN);

#
 
Added the requested breakout code, replacing within it, your K and D instead of FullK and FullD as folllows:
Thank you, can you add on on PRICE show the breakout? - OPTIONAL + Changeable, like Exponential code.
 

Attachments

  • Screenshot 2023-12-21 065348.KDJ.02.png
    Screenshot 2023-12-21 065348.KDJ.02.png
    98.7 KB · Views: 77

Join useThinkScript to post your question to a community of 21,000+ developers and traders.

Similar threads

Not the exact question you're looking for?

Start a new thread and receive assistance from our community.

87k+ Posts
437 Online
Create Post

Similar threads

Similar threads

The Market Trading Game Changer

Join 2,500+ subscribers inside the useThinkScript VIP Membership Club
  • Exclusive indicators
  • Proven strategies & setups
  • Private Discord community
  • ‘Buy The Dip’ signal alerts
  • Exclusive members-only content
  • Add-ons and resources
  • 1 full year of unlimited support

Frequently Asked Questions

What is useThinkScript?

useThinkScript is the #1 community of stock market investors using indicators and other tools to power their trading strategies. Traders of all skill levels use our forums to learn about scripting and indicators, help each other, and discover new ways to gain an edge in the markets.

How do I get started?

We get it. Our forum can be intimidating, if not overwhelming. With thousands of topics, tens of thousands of posts, our community has created an incredibly deep knowledge base for stock traders. No one can ever exhaust every resource provided on our site.

If you are new, or just looking for guidance, here are some helpful links to get you started.

What are the benefits of VIP Membership?
VIP members get exclusive access to these proven and tested premium indicators: Buy the Dip, Advanced Market Moves 2.0, Take Profit, and Volatility Trading Range. In addition, VIP members get access to over 50 VIP-only custom indicators, add-ons, and strategies, private VIP-only forums, private Discord channel to discuss trades and strategies in real-time, customer support, trade alerts, and much more. Learn all about VIP membership here.
How can I access the premium indicators?
To access the premium indicators, which are plug and play ready, sign up for VIP membership here.
Back
Top