John Ehlers Zero Lag Indicator for ThinkorSwim

Srt4ever

New member
2019 Donor
This is not mine and I did not make it, I found it on another thread and wanted to share here with y'all. Also is it possible for someone to make it as close to the original as possible ? I will post a link to John Ehlers original code on his website.

Code:
#NICA_ZEROLAG
#This is my version, anyone is welcome to play with it and modify it for better results.

input length = 32;
input GainLimit = 22;
input Thresh = 0.75;

def alpha = 2 / (length + 1);

def EMA = alpha * close + (1 - alpha) * EMA[1];

def Value1 = -GainLimit + GainLimit;
def Gain = Value1 / 10;

def EC = alpha * (EMA + Gain * (close - EC[1])) + (1 - alpha) * EC[1];
def Error = close - EC;

def BestGain = Gain;

def LeastError = 1000000;

plot EC1 = alpha * (EMA + BestGain * (close - EC[1])) + (1 - alpha) * EC[1];
EC1.SetDefaultColor(Color.ORANGE);

plot EMA48 = alpha * close + (1 - alpha) * EMA[1];
#Plot1(EC);

#Plot3(EMA);

#plot EC Crosses Over EMA and 100*LeastError / Close > Thresh Then Buy Next Bar on Open;
#plot EC crosses Under EMA and 100*LeastError / Close > Thresh Then Sell Short Next Bar on Open;
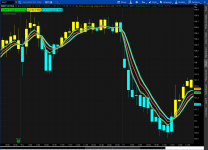
 
Here's the Zero Lag EMA indicator:

Code:
# Zero Lag EMA (Using an Error Correcting Filter)
# Mobius
# Ported to TOS 08.31.2016 from Article by John Ehlers
# Using an EMA error term, the current price – EMA[1], the amplitude of the error term is altered by multiplying the error by a gain term. The new filter is an EC or Error Corrected EMA.

# Inputs:
input Length = 20;
input GainLimit = 50;
input LabelsOn = yes;

# Vars:
def alpha;
def BestGain;
def EC1;
def Gain;
def EC;
def Error;
def LeastError;
def EMA;
alpha = 2 / (Length + 1);
EMA = alpha * close + (1 - alpha) * EMA[1];
plot EMAdata = EMA;
EMAdata.SetDefaultColor(Color.Yellow);

Gain = fold g = -GainLimit to GainLimit
       do getValue(g / 10, g);
EC1 = fold V = -GainLimit to GainLimit
      do alpha * (EMA + (fold i = -GainLimit to GainLimit
                         do i / 10) * (Close - EC1[1])) + (1 - alpha) * EC1[1];
Error = AbsValue(Close - EC1);
If Error < 1000000
Then {
LeastError = Error;
BestGain = Gain;
} else {
LeastError = LeastError[1];
BestGain = 0;
}
EC = alpha * (EMA + BestGain * (Close - EC1)) + (1 - alpha) * EC1;
Plot ECdata = EC;
ECdata.SetDefaultColor(Color.Cyan);
AddLabel(LabelsOn, "Standard EMA", color.yellow);
AddLabel(LabelsOn, "Error Corrected EMA", color.cyan);
#End Code Error Corrected EMA

Here is the Forward Reverse EMA by Mobius

Code:
# Forward / Reverse EMA
# (c) 2017 John F. Ehlers
# Ported to TOS 07.16.2017
# Mobius

declare lower;

# Inputs:
input AA = .1;

# Vars:
def CC;
def RE1;
def RE2;
def RE3;
def RE4;
def RE5;
def RE6;
def RE7;
def RE8;
def EMA;
plot Signal;
plot plot0;

CC = if CC[1] == 0 then .9 else 1 – AA;
EMA = AA * Close + CC * EMA[1];
RE1 = CC * EMA + EMA[1];
RE2 = Power(CC, 2)   * RE1 + RE1[1];
RE3 = Power(CC, 4)   * RE2 + RE2[1];
RE4 = Power(CC, 8)   * RE3 + RE3[1];
RE5 = Power(CC, 16)  * RE4 + RE4[1];
RE6 = Power(CC, 32)  * RE5 + RE5[1];
RE7 = Power(CC, 64)  * RE6 + RE6[1];
RE8 = Power(CC, 128) * RE7 + RE7[1];

Signal = EMA – AA * RE8;
signal.AssignValueColor(if Signal > Signal[1]
                        then color.green
                        else color.red);
Plot0 = if isNaN(close) then double.nan else 0;
Plot0.SetDefaultColor(Color.gray);
addCloud(0, Signal, color.red, color.green);
# End Code Ehlers Forward / Reverse EMA
 

Join useThinkScript to post your question to a community of 21,000+ developers and traders.

@Srt4ever Just look in ToS for EhlersRoofingFilter, EhlersDecyclerOscillator or EhlersForwardReverseEMA. All three will give same signals as Ehlers Zero Lag you describe. The study you quoted above should plot as described in the linked article. Just adjust the length as you wish.

The Mobius study mentioned has a less smooth EMA possibly due to high gain. I suggest lowering the gain if you try that one. Why not use one of the lower studies and unclutter your upper chart as they give the same crossover signals. I thought I had a fancier Ehlers one but a quick search did not find it, oh well it gave the same crossovers. I think it colored the candles also. One day I may run across it again.

Closest match I could get with my study is EMA 4 gain 1. Green/Red is study being mentioned by Tenacity. Experiment at your own risk.

exbsPOn.png
 

Attachments

  • exbsPOn.png
    exbsPOn.png
    153.9 KB · Views: 241
# Zero Lag EMA (Using an Error Correcting Filter) # Mobius
I just started using this with parameters of 13,3

Code:
# Zero Lag Exponential Moving Average
# Mobius
# V01.07.2010
# Maintains the weighting of most recent price but removes the infinite weighting of past price.

nput length = 10;

def K = 2 / (length + 1);
def lag = (length - 1) / 2;
def ZLEMA = K * (2 * close - close[lag]) + (1 - K) * ZLEMA[1];
plot data = ZLEMA;
# End Code Zero Lag EMA
 
Just wanted to add: as far as I understand and was revealed in comparative testing (and I could be wrong)- The best use of ehlers super smooth filter is to get nice medium-long termish trend (e.g. period 20 or so). Under 10 it does not make much sense to use. On daily 34 period is quite good
 
Just wanted to add: as far as I understand and was revealed in comparative testing (and I could be wrong)- The best use of ehlers super smooth filter is to get nice medium-long termish trend (e.g. period 20 or so). Under 10 it does not make much sense to use. On daily 34 period is quite good

His actual study suggest Length= 32 Gain= 22 and Thresh= 0.75

"When the Zero Lag Strategy was applied to five years of 100 shares of MSFT with settings Length = 32, GainLimit = 22, and Thresh = 0.75 we obtained the following hypothetical results:
Net Profit $3,107 # Trades 20 Profit/Trade $155 % Profitable Trades 60% Profit Factor 4.1"

Study can be found here: http://www.mesasoftware.com/papers/ZeroLag.pdf
 

Similar threads

Not the exact question you're looking for?

Start a new thread and receive assistance from our community.

87k+ Posts
376 Online
Create Post

Similar threads

Similar threads

The Market Trading Game Changer

Join 2,500+ subscribers inside the useThinkScript VIP Membership Club
  • Exclusive indicators
  • Proven strategies & setups
  • Private Discord community
  • ‘Buy The Dip’ signal alerts
  • Exclusive members-only content
  • Add-ons and resources
  • 1 full year of unlimited support

Frequently Asked Questions

What is useThinkScript?

useThinkScript is the #1 community of stock market investors using indicators and other tools to power their trading strategies. Traders of all skill levels use our forums to learn about scripting and indicators, help each other, and discover new ways to gain an edge in the markets.

How do I get started?

We get it. Our forum can be intimidating, if not overwhelming. With thousands of topics, tens of thousands of posts, our community has created an incredibly deep knowledge base for stock traders. No one can ever exhaust every resource provided on our site.

If you are new, or just looking for guidance, here are some helpful links to get you started.

What are the benefits of VIP Membership?
VIP members get exclusive access to these proven and tested premium indicators: Buy the Dip, Advanced Market Moves 2.0, Take Profit, and Volatility Trading Range. In addition, VIP members get access to over 50 VIP-only custom indicators, add-ons, and strategies, private VIP-only forums, private Discord channel to discuss trades and strategies in real-time, customer support, trade alerts, and much more. Learn all about VIP membership here.
How can I access the premium indicators?
To access the premium indicators, which are plug and play ready, sign up for VIP membership here.
Back
Top