Hi everyone,
I would please like to create a script that will execute when the price increases 5% from when the MACD Diff goes above zero for the first time during regular trading hours. In the coding section below I have inserted the code for when MACD Diff goes above zero, I am just not sure how to specify when it occurs for the first time after the market open (9:30 a.m.) and how to identify the price for the open of this specific candle.
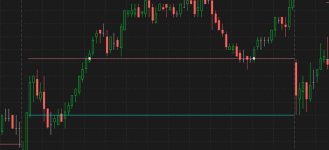
An example of what I am looking to achieve would be, if the price was $1.00 when the MACD Diff went above zero then I would want to sell when the stock price was $1.05. Would someone be able to help me with this please? I have included an image here to describe what I am looking to achieve. Thank you very much for your time and help.

I would please like to create a script that will execute when the price increases 5% from when the MACD Diff goes above zero for the first time during regular trading hours. In the coding section below I have inserted the code for when MACD Diff goes above zero, I am just not sure how to specify when it occurs for the first time after the market open (9:30 a.m.) and how to identify the price for the open of this specific candle.
Code:
def d = MACDHistogram().diff;
def goodMACD = d > 0;
An example of what I am looking to achieve would be, if the price was $1.00 when the MACD Diff went above zero then I would want to sell when the stock price was $1.05. Would someone be able to help me with this please? I have included an image here to describe what I am looking to achieve. Thank you very much for your time and help.
Last edited: