I have reached MY answer to an important question, and I am not alone in asking it — many experienced traders here on this site eventually reach this exact realization,
Most indicators are derived from the same data (price and volume), and many are just variations of each other — meaning they tend to behave similarly, especially during the same market regimes.
I have written or adjusted over 200 scripts in the 2 years I have started using TOS. I have in theory made a “sandwich” about as many ways there is to make a “sandwich” and I have come to realize, even though one may taste better to me than others, that they are all the same “sandwich”.
Why Many Indicators "Act the Same"
Whether it's RSI, MACD, Stochastic, or CCI, they're just manipulating highs, lows, closes, averages, and ranges.
- They’re all based on price and/or volume.
Most of them are just different smoothing techniques applied to price behavior.
Many indicators are reactive, not predictive. They confirm momentum, trend, or volatility after price moves. (Like reading the Wall Street Journal and thinking you are now ready for tomorrow trading, lol, NOT)
- Indicators lag — and they often confirm the same thing.
Using 5 indicators that say “overbought” doesn’t give you 5x the certainty — just the same information 5 times.
- Multiple indicators ≠ more signal.
So Should You Use Just 1–2 Indicators?
In many cases, yes — but with intentional diversity. Ideally, you want one indicator per category:
Category Use One Tool Examples Trend Directional bias Moving Average, ADX Momentum Strength of price movement RSI, MACD, Stochastic Volatility Expansion/contraction ATR, Bollinger Bands Volume-based Confirmation of price moves OBV, VWAP, Accum/Distrib Price action Structure/patterns Candlesticks, pivots, HH/LLs
The Ideal Setup for Clarity
You don’t need 10 indicators — but you do need balance and context. Here’s an example minimalist but high-signal setup:
That’s it. Everything else can clutter, not clarify.
- Price Action + EMAs – tells you trend and structure.
- RSI or Stochastic – shows momentum + potential reversal points.
- Volume or VWAP – confirms participation.
My Final Thought
Instead of stacking indicators, stack edges from different dimensions- price structure, momentum, volatility, and volume. (Maybe throw in MTF for another level of validations)
I have developed a Studies Set, but it includes some VIP scripts that I can not share here. This set has done very well this week and will need others to use it to validate its success rate and profit ratio. My suggestion is you join the VIP section, cheap for what you get. I will be writing up directions for use soon. (the only thing extra I might add are the previous day high and lows, they seem 50% of the time to act as support and resistances)
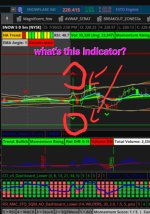
View attachment 25326
mod note:
for those reading. take the discussion, thought and want of these indicators out of your mind. read the post for what it is. one of the best posts i have seen on here.