Hull Format, Label, Watchlist, Scan for ThinkorSwim

Join useThinkScript to post your question to a community of 21,000+ developers and traders.

took a pass at porting it:

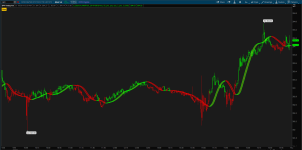
HMA
cAz6Qrf.png


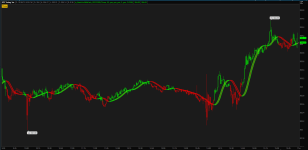
EHMA
96bRpzV.png


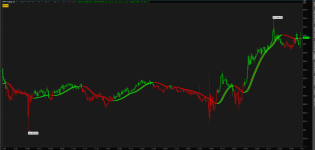
THMA
yNCgIsD.png


Ruby:
#Basic Hull Ma Pack tinkered by InSilico
#Original Port from https://www.tradingview.com/script/hg92pFwS-Hull-Suite
#
#2019.10.30 1.0 @diazlaz - Original Port
#

#INPUTS

input modeSwitch = {default "Hma", "Thma", "Ehma"}; #Hull Variation
input length = 55; #Length(180-200 for floating S/R , 55 for swing entry)
input switchColor = yes; #Color Hull according to trend?
input candleCol = yes; #Color candles based on Hull's Trend?
input visualSwitch = yes; #Show as a Band?
input thicknesSwitch = 2; #Line Thickness
input showLabels = yes;
input src = close; #Source

addLabel (showLabels, modeSwitch, COLOR.ORANGE);
def na = Double.NaN;

# HMA

def hma;
switch (modeSwitch) {
case "Hma":
    hma = wma(2 * wma(src, length / 2) - wma(src, length), round(sqrt(length)));
case "Ehma":
    hma = expAverage(2 * expAverage(src, length / 2) - expAverage(src, length), round(sqrt(length)));
case "Thma":
    hma = wma(wma(src,(length/2) / 3) * 3 - wma(src, (length/2) / 2) - wma(src, (length/2)), (length/2));
}

# PLOTS

def HULL = hma;
def MHULL = HULL[0];
def SHULL = HULL[2];

plot Fi1 = MHULL;
Fi1.AssignValueColor(
if HULL > HULL[2] then COLOR.GREEN else COLOR.RED
);
Fi1.SetLineWeight(thicknesSwitch);

plot Fi2 = SHULL;
Fi2.AssignValueColor(
if HULL > HULL[2] then COLOR.GREEN else COLOR.RED
);
Fi2.SetLineWeight(thicknesSwitch);
Fi2.SetHiding(!visualSwitch);

AddCloud (if visualSwitch then Fi1 else na, Fi2);

# COLORBARS
AssignPriceColor(
if !candleCol then
Color.CURRENT
else
if HULL > HULL[2] then COLOR.GREEN else COLOR.RED
);

#END OF HULL

Please provide any feedback, bugs, backtests, experiences, optimizations on how to best use it.
 

Attachments

  • cAz6Qrf.png
    cAz6Qrf.png
    107.9 KB · Views: 273
  • yNCgIsD.png
    yNCgIsD.png
    94.6 KB · Views: 220
  • 96bRpzV.png
    96bRpzV.png
    160.9 KB · Views: 250
I've looked at it with Crude on a daily chart with the 55 setting. It confirms a trend VERY well, however, it is a bit too slow for crude for an entry, but that is only crude. And when I change it to, say a 34 period, it generated a few too many whip saws on crude. But Heck! to confirm a trend like it does is awesome! it would keep someone in a swing trade much longer and it appears to capture much more of a longer swing trade if one could follow the past signals.
 
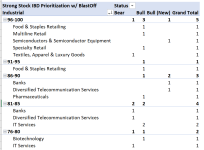
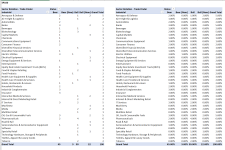
Hi Everyone, I wanted to pick this up and connect some of the dots. So the first criteria i'm using is taking the SP100, list of stocks and industries, then mapping it to the Hull Bull or Bear Category, and also added a Bull (New) or Bear (New) if the state of the symbol changed in the last 24 hours and is new, then pivoted it by industry, and then group it to the NetChange %52WksChange (IBD) formula to identify the hottest stock in the sector, then lastly crossed reference it with Ben's Blast Off.

In the SP100 there are 32 stocks that triggered the Blast Off condition on Friday. Quick Bullish outcome.


57zXJTZ.png


szosoHV.png


What can we all do with this? Any further enhancements or feedback to this system/approach? I will share it but expect in return community collaboration to enhance it further in return.

Top 5 Stocks that are ready to blast off - Week ending October 18th 2019.

TWqvKc4.png


If anyone is willing to start putting together a trading system around this and perhaps all can test, backtest and benchmark, i will start a separate thread and see if we can build a weekly trading system with entries and exits. anyone willing to take a first step at it?

Hi

I see this post today and see value in developing a strategy or idea using sector rotation

I would like to lean and support the idea but initially I may need some help in understanding the idea so that we can continue the thread with updates .
I can give weekly 2-3 posts time to support this effort for everyone benefit ..

Let me know if that is a good start

Thx
Suresh
 

Attachments

  • TWqvKc4.png
    TWqvKc4.png
    161.7 KB · Views: 200
  • szosoHV.png
    szosoHV.png
    53.3 KB · Views: 200
  • 57zXJTZ.png
    57zXJTZ.png
    117.3 KB · Views: 198
@diazlaz - thanks for this great indicator. I'm trying to add alerts to it for when the color changes occur and can't get the code right. What would the correct thinkscript code be?
 
@shizah I have modified @diazlaz Hull Pack study to add alerts. It now rings an alert whenever the color transitions from green to red or vice versa. Here is the revised study, I have tested it both ways on the /ES. Have fun
Code:
#Basic Hull Ma Pack tinkered by InSilico
#Original Port from https://www.tradingview.com/script/hg92pFwS-Hull-Suite
#
# 2019.10.30 1.0 [USER=258]@diazlaz[/USER] - Original Port
# 2019.11.14 2.0 [USER=1369]@tomsk[/USER]   - Added alerts for color bar transitions

input modeSwitch = {default "Hma", "Thma", "Ehma"}; #Hull Variation
input length = 55; #Length(180-200 for floating S/R , 55 for swing entry)
input switchColor = yes; #Color Hull according to trend?
input candleCol = yes; #Color candles based on Hull's Trend?
input visualSwitch = yes; #Show as a Band?
input thicknesSwitch = 2; #Line Thickness
input showLabels = yes;
input src = close; #Source

addLabel (showLabels, modeSwitch, Color.ORANGE);

def hma;
switch (modeSwitch) {
case "Hma":
    hma = wma(2 * wma(src, length / 2) - wma(src, length), round(sqrt(length)));
case "Ehma":
    hma = expAverage(2 * expAverage(src, length / 2) - expAverage(src, length), round(sqrt(length)));
case "Thma":
    hma = wma(wma(src,(length/2) / 3) * 3 - wma(src, (length/2) / 2) - wma(src, (length/2)), (length/2));
}

def hull = hma;
def Mhull = hull[0];
def Shull = hull[2];
def transition = hull > hull[2];

plot Fi1 = Mhull;
Fi1.AssignValueColor(if transition then Color.GREEN else Color.RED);
Fi1.SetLineWeight(thicknesSwitch);

plot Fi2 = Shull;
Fi2.AssignValueColor(if transition then Color.GREEN else Color.RED);
Fi2.SetLineWeight(thicknesSwitch);
Fi2.SetHiding(!visualSwitch);

AddCloud (if visualSwitch then Fi1 else Double.NaN, Fi2);
AssignPriceColor(if !candleCol then Color.CURRENT else if transition then COLOR.GREEN else COLOR.RED);

Alert((!transition[1] and transition) or (transition[1] and !transition), "Hull Color Change", Alert.BAR, Sound.RING);
# END
 
@tomsk How do you post this study as a scan?


@mailbagman2000 Here is the study converted into a scan. Note that there are two plot statements in the scan. I have configured this for the bullish case. If you'd like to use the bullish bearish scan, just comment out the bullish scan and uncomment the bearish scan. All this is listed at the end of the file. In case you're not sure, please read the following post.

https://usethinkscript.com/threads/how-to-use-the-tos-scanner.284/#post-10505
Here then is your COMPLETED scan code. I have tested this against a scan of the S&P 500 using daily aggregation a few minutes ago. A bullish scan has 4 results while a bearish scan has 5 results.

Code:
# Basic Hull Ma Pack Scan
# tomsk
# 12.27.2019

# Basic Hull Ma Pack tinkered by InSilico
# Original Port from https://www.tradingview.com/script/hg92pFwS-Hull-Suite

input modeSwitch = {default "Hma", "Thma", "Ehma"}; #Hull Variation
input length = 55; #Length(180-200 for floating S/R , 55 for swing entry)
input src = close; #Source

def hma;
switch (modeSwitch) {
case "Hma":
    hma = wma(2 * wma(src, length / 2) - wma(src, length), round(sqrt(length)));
case "Ehma":
    hma = expAverage(2 * expAverage(src, length / 2) - expAverage(src, length), round(sqrt(length)));
case "Thma":
    hma = wma(wma(src,(length/2) / 3) * 3 - wma(src, (length/2) / 2) - wma(src, (length/2)), (length/2));
}

def hull = hma;
def transition = hull > hull[2];

# Delete (#) the plot not needed

plot scanBull = !transition[1] and transition;
#plot scanBear = transition[1] and !transition;

# End Basic Hull Ma Pack Scan
 
I downloaded and saved the Hull
Here is a custom watchlist column for ThinkorSwim that shows when the Hull Moving Average is changing direction. This is great for traders with a lot of stocks on their watchlist and need a quick way to identify potential trend changes via the Hull moving average (HMA) indicator.

When importing the watchlist, be sure to select the timeframe you wish to use. The Daily is set as default.

siK6Lp7.png


thinkScript Code

Code:
#Follow @Krose_TDA on twitter for updates to this and other custom columns
#TD Ameritrade IP Company, Inc. (c) 2008-2019
#Follow @Krose_TDA on twitter for updates to this and other custom columns
#Input desired parameters using the input statements below

input price = close;
input length = 20;
input WithinBars = 1;

def hma = HullMovingAvg(price,length);

def TriglableBull = hma[1]<hma[2] and hma>hma[1];
def TriglableBear = hma[1]>hma[2]and hma < hma[1];
def trigger = TriglableBear or TriglableBull;

addlabel(yes,if triglableBear then "bear" else if TriglableBull then "Bull" else " ");

Shareable Link

https://tos.mx/x3Rk12Z
Watch this video to learn more about it


Credit: Ken Rose
I downloaded and saved the HullMovingMoving Watchlist. When I click on the gear icon in my watchlist and look in the left column the Hull Moving average that I saved does not appear so I cant move it to the right watchlist column. I can see the study if I want to add it to the chart but not the watchlist. I must be overlooking something very simple.
 
I was able to load that code into my watchlist with no problem. When you say you saved it, did you make a note of where you saved it?
For me I selected one of the available watchlist columns called Custom20, you will need to add that item to the current set and move it to your desired location. If you're having problems I suggest you contact TOS live support for a walkthrough. The process is quite straighforward but it this is the very first time you are manipulating a watchlist column, it might not be as intuitive.
.
OK, thanks for taking the time to answer my question. Here is exactly what I did. (1) I copied the above code. (2) From the chart, I clicked on edit studies. (3) I clicked create and paste the script in the window. I renamed the Study Hullwatchlist and clicked OK (4) I clicked on the gear icon on my watch list. I have 2 columns. On the left side, I searched for the Hullwatchlist but it is not there. If I go back to my chart and chart and click on edit studies I can see Hull watchlist I could add it to my chart if I wanted but it is not in the left column under studies in the watchlist area.
 
Sounds like you did not configure the code directly in the watchlist. From your description you seemed to add it as a chart study
Probably best to contact TOS support and have them walk you through how to set things up specifically for a watchlist.
 
Sounds like you did not configure the code directly in the watchlist. From your description you seemed to add it as a chart study
Probably best to contact TOS support and have them walk you through how to set things up specifically for a watchlist.
One last question. When you loaded the code successfully did you do it any different way then I did?
 
Yes - I did not have to load it in the charts. I just loaded it directly under MarketWatch > Quotes, there is kind of a wheel/sprocket on the far right, click that - it brings you to "Customize Quotes". From there I look for an unused template. I selected Custom20. Click Add Items. At this point I renamed the column as HULL and add the code from post #1. Click OK and I'm done. This is a bit difficult to explain via a forum. That's why I suggest you contact someone from TOS support to walk you through the steps
 

Similar threads

Not the exact question you're looking for?

Start a new thread and receive assistance from our community.

87k+ Posts
345 Online
Create Post

Similar threads

Similar threads

The Market Trading Game Changer

Join 2,500+ subscribers inside the useThinkScript VIP Membership Club
  • Exclusive indicators
  • Proven strategies & setups
  • Private Discord community
  • ‘Buy The Dip’ signal alerts
  • Exclusive members-only content
  • Add-ons and resources
  • 1 full year of unlimited support

Frequently Asked Questions

What is useThinkScript?

useThinkScript is the #1 community of stock market investors using indicators and other tools to power their trading strategies. Traders of all skill levels use our forums to learn about scripting and indicators, help each other, and discover new ways to gain an edge in the markets.

How do I get started?

We get it. Our forum can be intimidating, if not overwhelming. With thousands of topics, tens of thousands of posts, our community has created an incredibly deep knowledge base for stock traders. No one can ever exhaust every resource provided on our site.

If you are new, or just looking for guidance, here are some helpful links to get you started.

What are the benefits of VIP Membership?
VIP members get exclusive access to these proven and tested premium indicators: Buy the Dip, Advanced Market Moves 2.0, Take Profit, and Volatility Trading Range. In addition, VIP members get access to over 50 VIP-only custom indicators, add-ons, and strategies, private VIP-only forums, private Discord channel to discuss trades and strategies in real-time, customer support, trade alerts, and much more. Learn all about VIP membership here.
How can I access the premium indicators?
To access the premium indicators, which are plug and play ready, sign up for VIP membership here.
Back
Top