Hull Format, Label, Watchlist, Scan for ThinkorSwim

BenTen

Administrative
Staff member
Staff
VIP
Lifetime
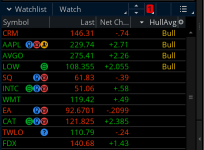
Here is a custom watchlist column for ThinkorSwim that shows when the Hull Moving Average is changing direction. This is great for traders with a lot of stocks on their watchlist and need a quick way to identify potential trend changes via the Hull moving average (HMA) indicator.

When importing the watchlist, be sure to select the timeframe you wish to use. The Daily is set as default.

siK6Lp7.png


thinkScript Code

Code:
#Follow @Krose_TDA on twitter for updates to this and other custom columns
#TD Ameritrade IP Company, Inc. (c) 2008-2019
#Follow @Krose_TDA on twitter for updates to this and other custom columns
#Input desired parameters using the input statements below

input price = close;
input length = 20;
input WithinBars = 1;

def hma = HullMovingAvg(price,length);

def TriglableBull = hma[1]<hma[2] and hma>hma[1];
def TriglableBear = hma[1]>hma[2]and hma < hma[1];
def trigger = TriglableBear or TriglableBull;

addlabel(yes,if triglableBear then "bear" else if TriglableBull then "Bull" else " ");

Shareable Link

https://tos.mx/x3Rk12ZCredit: Ken Rose
 

Attachments

  • siK6Lp7.png
    siK6Lp7.png
    40.6 KB · Views: 326
Last edited by a moderator:
I often use the Hull Moving Avg to find stocks reversing. Is there a scanner script to search for Hull Moving Average When it changes color for uptrend? Thanks
 
Not sure if this is what you are looking for but this might help.

Code:
#MACD based on Hull Moving Average W/peak/ebb arrows

#TOS title = MACD_via_Hull_MA_fav


declare lower;


input fastLength = 12;

input slowLength = 26;

input MACDLength = 9;

input AverageType = {SMA, EMA, default HULL};


plot Value;

plot Avg;

switch (AverageType) {

  case SMA:

    Value = Average(close, fastLength) - Average(close, slowLength);

    Avg = Average(Value, MACDLength);

  case EMA:

    Value = ExpAverage(close, fastLength) - ExpAverage(close, slowLength);

    Avg = ExpAverage(Value, MACDLength);

  case HULL:

    Value =  MovingAverage(AverageType.HULL, close, fastLength) -  MovingAverage(AverageType.HULL, close, slowLength);

    Avg = Average(Value, MACDLength);

}


plot Diff = Value - Avg;

plot ZeroLine = 0;

Value.SetDefaultColor(GetColor(1));

Avg.SetDefaultColor(GetColor(8));

Diff.SetDefaultColor(GetColor(5));

Diff.SetPaintingStrategy(PaintingStrategy.HISTOGRAM);

Diff.SetLineWeight(3);

Diff.DefineColor("Positive and Up", Color.GREEN);

Diff.DefineColor("Positive and Down", Color.DARK_GREEN);

Diff.DefineColor("Negative and Down", Color.RED);

Diff.DefineColor("Negative and Up", Color.DARK_RED);

Diff.AssignValueColor(if Diff >= 0 then if Diff > Diff[1] then Diff.color("Positive and Up") else Diff.color("Positive and Down") else if Diff < Diff[1] then Diff.color("Negative and Down") else Diff.color("Negative and Up"));

ZeroLine.SetDefaultColor(GetColor(0));


#plot Min arrows*

def MinArrow = if (Value < Value[1] and value[1] < Value[2] and value[2] < Value[3] and value[-1] > Value and value < 0)

  then 0

  else if (Value > Value[1])

  then double.nan

  else double.nan;


plot UpArrow = if(MinArrow == 0, value, double.nan);

UpArrow.AssignValueColor(Color.Green);

UpArrow.SetPaintingStrategy(PaintingStrategy.ARROW_UP);

UpArrow.SetLineWeight(1);

UpArrow.HideBubble();


#plot Max arrows*

def MaxArrow = if (Value > Value[1] and value[1] > Value[2] and value[2] > Value[3] and value[-1] < Value and value > 0)

  then 0

  else if (Value > Value[1])

  then double.nan

  else double.nan;


plot DwnArrow = if(MaxArrow == 0, value, double.nan);

DwnArrow.AssignValueColor(Color.cyan);

DwnArrow.SetPaintingStrategy(PaintingStrategy.ARROW_Down);

DwnArrow.SetLineWeight(1);

DwnArrow.HideBubble();


#plot Max signal(Avg) arrows*

def SignalArrow = if (Avg > Avg[1] and Avg[1] > Avg[2] and Avg[2] > Avg[3] and Avg[-1] < Avg and Avg > 0)

  then 0

  else if (Avg > Avg[1])

  then double.nan

  else double.nan;


plot downSignalArrow = if(SignalArrow == 0, avg, double.nan);

downSignalArrow.AssignValueColor(Color.yellow);

downSignalArrow.SetPaintingStrategy(PaintingStrategy.ARROW_Down);

downSignalArrow.SetLineWeight(1);

downSignalArrow.HideBubble();


AddCloud(ZeroLine, Value, color.RED, color.GREEN);

# end

This is the source I found it from.

https://github.com/jshingler/TOS-an...llection.md#MACD_BASED_ON_HULL_MOVING_AVERAGE
 
Last edited by a moderator:
This is great, but is there any way it could stay on the word "Bull" until it changes to Bearish, and when its Bearish to stay on that word until it turns back to bullish. The words disappear after one candle, if that could get fix this would be great I love it. Thanks!!!
 
This is great, but is there any way it could stay on the word "Bull" until it changes to Bearish, and when its Bearish to stay on that word until it turns back to bullish. The words disappear after one candle, if that could get fix this would be great I love it. Thanks!!!

Here you go!

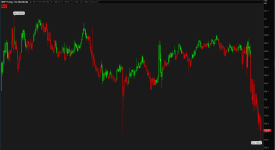
Chart Behavior

RQ4nGUX.png


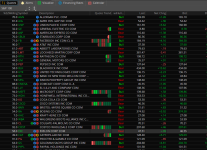
Watchlist:

r7fQNw7.png


Ruby:
#Follow @Krose_TDA on twitter for updates to this and other custom columns
#TD Ameritrade IP Company, Inc. (c) 2008-2019
#Follow @Krose_TDA on twitter for updates to this and other custom columns
#Input desired parameters using the input statements below
#
#2019.10.11 - @diazlaz - Updated to include persist state
#

input price = close;
input length = 20;
input WithinBars = 1;

def hma = HullMovingAvg(price,length);

def TriglableBull = hma[1]<hma[2] and hma>hma[1];
def TriglableBear = hma[1]>hma[2]and hma < hma[1];
def trigger = TriglableBear or TriglableBull;
def sTrigger = if TriglableBear then -100 else if TriglableBull then 100 else sTrigger[1];

AddLabel(yes,
if sTrigger == -100 then "Bear" else "Bull",
if sTrigger == -100 then COLOR.RED  else COLOR.GREEN
);

#plot results = sTrigger;
 

Attachments

  • RQ4nGUX.png
    RQ4nGUX.png
    102.7 KB · Views: 299
  • r7fQNw7.png
    r7fQNw7.png
    220.5 KB · Views: 307
Last edited:
What's also interesting, is that you can put let's say the SP500, with industry information, then export to excel, pivot on the Bear and Bull columns, wonder if this help you all build a watchlist and pivot on the market leaders by industry by sub-industry and then build travels with the highest momentum and index for the subset of the index.

If anyone has any good strategies or ideas on leveraging this column to help in sector rotation or sector stock selection please share ;)
 
What's also interesting, is that you can put let's say the SP500, with industry information, then export to excel, pivot on the Bear and Bull columns, wonder if this help you all build a watchlist and pivot on the market leaders by industry by sub-industry and then build travels with the highest momentum and index for the subset of the index.
If anyone has any good strategies or ideas on leveraging this column to help in sector rotation or sector stock selection please share ;)
@diazlaz
If anyone has any good strategies or ideas on leveraging this column to help in sector rotation or sector stock selection please share
This is something that I and JohnnyQuotron from the TSL have been on a quest to find. It is an excellent idea. I don't know about leveraging that particular column but I do have one share to study which might help if a Hull(20) was used.
 
Thanks all! I have a few ideas, going to work up an experiment over the weekend and look at the studies you all have provided to see if we can create something here and build upon all of this.

Thanks All!
 
@markos this is amazing work. all that is remaining is to capture the net change of the previous value (add it to the label) to see the net change easily in the label. then track the net change daily.
 
@BenTen I setup the watchlist, but it keeps showing me "customer expression". I am pretty sure I must have done something wrong, just do not know what. Can you please assist? thanks,
 
@markos this is amazing work. all that is remaining is to capture the net change of the previous value (add it to the label) to see the net change easily in the label. then track the net change daily.
Right now I am strapped for time, at least for the next week it will be hit and run. I was thinking of sector rotation for the 1wk, 2wk, and 4 wk periods, to attempt to catch the turn early. I just pulled those numbers out of thin air....
The SPY, IF it is in the code should be at 50 so that we can see if a certain sector is outperforming the overall SP500. Just a thought, might be a bad one. ?? What ever happens, this would need to go back to it's original creator, ED_nn.
 
@markos thanks for sharing such indicator. Is this to be used on Daily timeframe only? Thanks,
A Hull can be used on almost any time frame. You would have to play with it and let us know your thoughts. 20 day for weekly, 10 day for daily is where I would start. Run it on several charts and post them so that all can see how they behave.
 

Join useThinkScript to post your question to a community of 21,000+ developers and traders.

Similar threads

Not the exact question you're looking for?

Start a new thread and receive assistance from our community.

87k+ Posts
296 Online
Create Post

Similar threads

Similar threads

The Market Trading Game Changer

Join 2,500+ subscribers inside the useThinkScript VIP Membership Club
  • Exclusive indicators
  • Proven strategies & setups
  • Private Discord community
  • ‘Buy The Dip’ signal alerts
  • Exclusive members-only content
  • Add-ons and resources
  • 1 full year of unlimited support

Frequently Asked Questions

What is useThinkScript?

useThinkScript is the #1 community of stock market investors using indicators and other tools to power their trading strategies. Traders of all skill levels use our forums to learn about scripting and indicators, help each other, and discover new ways to gain an edge in the markets.

How do I get started?

We get it. Our forum can be intimidating, if not overwhelming. With thousands of topics, tens of thousands of posts, our community has created an incredibly deep knowledge base for stock traders. No one can ever exhaust every resource provided on our site.

If you are new, or just looking for guidance, here are some helpful links to get you started.

What are the benefits of VIP Membership?
VIP members get exclusive access to these proven and tested premium indicators: Buy the Dip, Advanced Market Moves 2.0, Take Profit, and Volatility Trading Range. In addition, VIP members get access to over 50 VIP-only custom indicators, add-ons, and strategies, private VIP-only forums, private Discord channel to discuss trades and strategies in real-time, customer support, trade alerts, and much more. Learn all about VIP membership here.
How can I access the premium indicators?
To access the premium indicators, which are plug and play ready, sign up for VIP membership here.
Back
Top