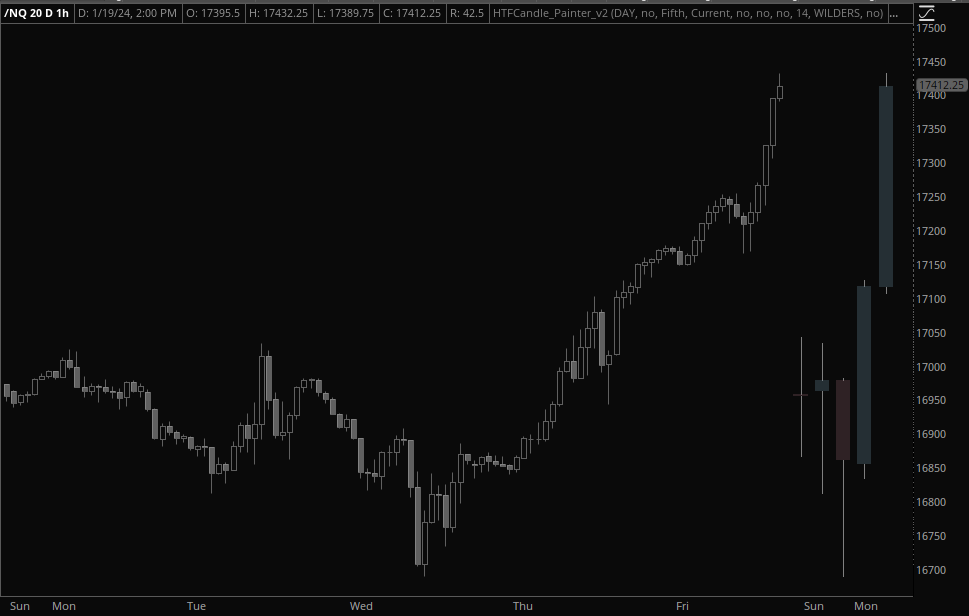
#hint: <b>Intro</b> \n This study displays a higher timeframe candle to the right of the chart in the expansion area. \n <li>Typically used for showing PO3 for daily chart</li> <li>You must have an expansion area of 4 or greater set for this to work</li>
#hint candleType: 0 is current, 1 is previous, 2 is 2 back, etc

# Created by @tony_futures inspired by the ICT Power of 3 concept
declare hide_on_daily;
input htf = AggregationPeriod.DAY;
input useMidnight = no;
input candle = { default "First", "Second", "Third", "Fourth", "Fifth", "Sixth", "Seventh", "Eighth", "Ninth", "Tenth"};
#input candleType = { default "Current", "Previous", "Two Back", "Three Back", "Four Back"};
def candleCount;
input candleType = 0;
def candlePos = candleType;

switch (candle)
{
    case "First":
      candleCount = 1;
    case "Second":
      candleCount = 4;
  case "Third":
      candleCount = 7;
  case "Fourth":
      candleCount = 10;
  case "Fifth":
      candleCount = 13;
  case "Sixth":
      candleCount = 16;
  case "Seventh":
      candleCount = 19;
  case "Eighth":
      candleCount = 22;
  case "Ninth":
      candleCount = 25;
  case "Tenth":
      candleCount = 28;
}

def wickOffset = candleCount;
def midnight = 0000;
def isMidnight = secondsFromTime(midnight) == 0;
def midPrice = if isMidnight then open else midPrice[1];
def xO0 = if useMidnight then midPrice else open(period = htf)[candlePos];
def xH0 = high(period = htf)[candlePos];
def xL0 = low(period = htf)[candlePos];
def xC0 = close(period = htf)[candlePos];


def exp2 = (isNaN(close[wickOffset]) OR isNaN(close[wickOffset+1]) OR isNaN(close[wickOffset+2])) and !isNan(close[wickOffset+3]);
def expMid = isNaN(close[wickOffset+1]) and !isNaN(close[wickOffset+2]);
def expMid2 = isNaN(close[wickOffset+2]) and !isNaN(close[wickOffset+3]);
def expEnd = isNaN(close[wickOffset+3]) and !isNaN(close[wickOffset+4]);
def expFinal = isNaN(close[wickoffset+3]);
def NaN = Double.NaN;

def priceOffset =  if expEnd then (wickOffset + 4) else if expMid then (wickOffset + 2) else if expMid2 then (wickOffset + 3) else (wickOffset + 1);
def XH = getValue(xH0, priceOffset);
def XO = getValue(xO0, priceOffset);
def xC = getValue(xC0, priceOffset);
def xL = getValue(xL0, priceOffset);

def isUp = xo < xc;
def isDn = xo > xc;
def isDoji = xO == xC;

# Global Color setup
DefineGlobalColor("greenCandle", CreateColor(103, 135, 151));
DefineGlobalColor("redCandle", CreateColor(136, 93, 100));
DefineGlobalColor("wick", Color.GRAY);

AddCloud( if exp2 and isUp then xC else NaN, xO, GlobalColor("greenCandle"), GlobalColor("redCandle"));
AddCloud( if exp2 and isDn then xO else NaN, xC, GlobalColor("redCandle"), GlobalColor("redCandle"));

plot dojiWick = if isDoji and exp2 then xO else NaN;
dojiWick.setDefaultColor(GlobalColor("wick"));

def wickHigh = if isUp then xC else xO;
def wickLow = if isDn then xC else xO;
AddChart(if expMid then xH else NaN, if expMid then wickHigh else Double.NaN,  NaN,  NaN, ChartType.BAR, GlobalColor("wick"));
AddChart(if expMid then xL else NaN, if expMid then wickLow else Double.NaN,  NaN,  NaN, ChartType.BAR, GlobalColor("wick"));

input showTimeFrameBubble = no;
def tf = htf/60000;
AddChartBubble(showTimeFrameBubble and expMid,xL,(if tf == 43200 then "M" else if tf == 10080 then "W" else if tf == 1440 then "D" else if tf == 240 then "4h" else if tf == 120 then "2h" else if tf == 60 then "H" else Round(tf,0)+"") + if candlePos != 0 then " -" + CandlePos else "",Color.WHITE,no);

input showBubbles = no;
AddChartBubble(showBubbles and expEnd and isUp, xO, xO, GlobalColor("greenCandle"), no);
AddChartBubble(showBubbles and expEnd and isDn, xO, xO, GlobalColor("redCandle"), yes);
AddChartBubble(showBubbles and expEnd, xL, xL, if isUp then GlobalColor("greenCandle") else GlobalColor("redCandle"), no);
AddChartBubble(showBubbles and expEnd, xH, xH, if isUp then GlobalColor("greenCandle") else GlobalColor("redCandle"), yes);

input showLabels = no;
def candleRange = xH - xL;
AddLabel(showLabels,(if tf == 43200 then "M" else if tf == 10080 then "W" else if tf == 1440 then "D" else if tf == 240 then "4h" else if tf == 120 then "2h" else if tf == 60 then "H" else AsText(tf)) + " Range: " + candleRange, if isUp then GlobalColor("greenCandle") else if isDn then GlobalColor("redCandle") else GlobalColor("wick"));

def xCL = close(period = htf)[candlePOS-1];
def lastCandle = isNaN(xCL);
input showAdditionalLines = no;

plot currentHigh = if showAdditionalLines and lastCandle and !expFinal then xH else NaN;
currentHigh.setPaintingStrategy(PaintingStrategy.DASHES);
currentHigh.setDefaultColor(GlobalColor("wick"));
currentHigh.DefineColor("Normal", GlobalColor("wick"));
currentHigh.DefineColor("Daily", GlobalColor("greenCandle"));
currentHigh.AssignValueColor(if tf == 1440 then currentHigh.Color("Daily") else currentHigh.Color("Normal"));


plot currentLow = if showAdditionalLines and lastCandle and !expFinal then xL else NaN;
currentLow.setPaintingStrategy(PaintingStrategy.DASHES);
currentLow.setDefaultColor(GlobalColor("wick"));
currentLow.DefineColor("Normal", GlobalColor("wick"));
currentLow.DefineColor("Daily", GlobalColor("redCandle"));
currentLow.AssignValueColor(if tf == 1440 then currentLow.Color("Daily") else currentLow.Color("Normal"));