High and Low with Fibonacci Retracement Indicator for ThinkorSwim

BenTen

Administrative
Staff member
Staff
VIP
Lifetime
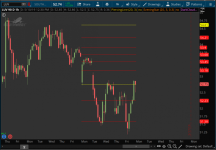
This indicator for ThinkorSwim takes the high and low of the previous week or month and add Fibonacci retracement levels to create potential support and resistance levels. You can also use the high and low of the previous day, yearly, etc. Up to you to select the right timeframe to help your trading style.

2qzTplK.png


thinkScript Code

Rich (BB code):
#
# WalkingBallista & BenTen
# https://usethinkscript.com/d/153-high-and-low-with-fibonacci-retracement-indicator-for-thinkorswim
input aggregationPeriod = AggregationPeriod.DAY;
input ShowTodayOnly = yes;

def PH = high(period = aggregationPeriod)[1];
def PL = low(period = aggregationPeriod)[1];
def PO = open(period = aggregationPeriod);
def Today = if GetDay() == GetLastDay() then 1 else 0;
def Week = if GetWeek() == GetLastWeek() then 1 else 0;

def range = PH - PL;
input fib = 1.618;
input fib1 = 1.272;
input fib2 = 0.618;
input fib3 = 0.236;
input fib4 = 0.382;
input fib5 = 0.5;
input fib6 = 0.786;
input fib7 = 2.618;

plot h = if ShowTodayOnly and !Today and aggregationPeriod == AggregationPeriod.Day then Double.NaN else if ShowTodayOnly and !Week and aggregationPeriod == AggregationPeriod.Week then Double.NaN else PH + range*(fib-1);
plot h1 = if ShowTodayOnly and !Today and aggregationPeriod == AggregationPeriod.Day then Double.NaN else if ShowTodayOnly and !Week and aggregationPeriod == AggregationPeriod.Week then Double.NaN else PH + range*(fib1-1);
plot h2 = if ShowTodayOnly and !Today and aggregationPeriod == AggregationPeriod.Day then Double.NaN else if ShowTodayOnly and !Week and aggregationPeriod == AggregationPeriod.Week then Double.NaN else PH + range*(fib2-1);
plot h3 = if ShowTodayOnly and !Today and aggregationPeriod == AggregationPeriod.Day then Double.NaN else if ShowTodayOnly and !Week and aggregationPeriod == AggregationPeriod.Week then Double.NaN else PH + range*(fib3-1);
plot h4 = if ShowTodayOnly and !Today and aggregationPeriod == AggregationPeriod.Day then Double.NaN else if ShowTodayOnly and !Week and aggregationPeriod == AggregationPeriod.Week then Double.NaN else PH + range*(fib4-1);
plot h5 = if ShowTodayOnly and !Today and aggregationPeriod == AggregationPeriod.Day then Double.NaN else if ShowTodayOnly and !Week and aggregationPeriod == AggregationPeriod.Week then Double.NaN else PH + range*(fib5-1);
plot h6 = if ShowTodayOnly and !Today and aggregationPeriod == AggregationPeriod.Day then Double.NaN else if ShowTodayOnly and !Week and aggregationPeriod == AggregationPeriod.Week then Double.NaN else PH + range*(fib6-1);
plot h7 = if ShowTodayOnly and !Today and aggregationPeriod == AggregationPeriod.Day then Double.NaN else if ShowTodayOnly and !Week and aggregationPeriod == AggregationPeriod.Week then Double.NaN else PH + range*(fib7-1);
plot h8 = if ShowTodayOnly and !Today and aggregationPeriod == AggregationPeriod.Day then Double.NaN else if ShowTodayOnly and !Week and aggregationPeriod == AggregationPeriod.Week then Double.NaN else PL - range*(fib1-1);
plot h9 = if ShowTodayOnly and !Today and aggregationPeriod == AggregationPeriod.Day then Double.NaN else if ShowTodayOnly and !Week and aggregationPeriod == AggregationPeriod.Week then Double.NaN else PL - range*(fib-1);
plot h10 = if ShowTodayOnly and !Today and aggregationPeriod == AggregationPeriod.Day then Double.NaN else if ShowTodayOnly and !Week and aggregationPeriod == AggregationPeriod.Week then Double.NaN else PL - range*(fib7-1);

h.DefineColor("Color", Color.DARK_RED);
h.AssignValueColor(h.color("Color"));
h.SetPaintingStrategy(PaintingStrategy.HORIZONTAL);

h1.DefineColor("Color", Color.RED);
h1.AssignValueColor(h1.color("Color"));
h1.SetPaintingStrategy(PaintingStrategy.HORIZONTAL);

h2.DefineColor("Color", Color.RED);
h2.AssignValueColor(h2.color("Color"));
h2.SetPaintingStrategy(PaintingStrategy.HORIZONTAL);

h3.DefineColor("Color", Color.RED);
h3.AssignValueColor(h3.color("Color"));
h3.SetPaintingStrategy(PaintingStrategy.HORIZONTAL);

h4.DefineColor("Color", Color.RED);
h4.AssignValueColor(h3.color("Color"));
h4.SetPaintingStrategy(PaintingStrategy.HORIZONTAL);

h5.DefineColor("Color", Color.RED);
h5.AssignValueColor(h3.color("Color"));
h5.SetPaintingStrategy(PaintingStrategy.HORIZONTAL);

h6.DefineColor("Color", Color.RED);
h6.AssignValueColor(h3.color("Color"));
h6.SetPaintingStrategy(PaintingStrategy.HORIZONTAL);

h7.DefineColor("Color", Color.RED);
h7.AssignValueColor(h3.color("Color"));
h7.SetPaintingStrategy(PaintingStrategy.HORIZONTAL);

h8.DefineColor("Color", Color.RED);
h8.AssignValueColor(h3.color("Color"));
h8.SetPaintingStrategy(PaintingStrategy.HORIZONTAL);

h9.DefineColor("Color", Color.RED);
h9.AssignValueColor(h3.color("Color"));
h9.SetPaintingStrategy(PaintingStrategy.HORIZONTAL);

h10.DefineColor("Color", Color.RED);
h10.AssignValueColor(h3.color("Color"));
h10.SetPaintingStrategy(PaintingStrategy.HORIZONTAL);

plot highofline = if ShowTodayOnly and !Today and aggregationPeriod == AggregationPeriod.Day then Double.NaN else if ShowTodayOnly and !Week and aggregationPeriod == AggregationPeriod.Week then Double.NaN else PH;
highofline.DefineColor("Color", Color.YELLOW);
highofline.AssignValueColor(highofline.color("Color"));
highofline.SetPaintingStrategy(PaintingStrategy.HORIZONTAL);

plot lowofline = if ShowTodayOnly and !Today and aggregationPeriod == AggregationPeriod.Day then Double.NaN else if ShowTodayOnly and !Week and aggregationPeriod == AggregationPeriod.Week then Double.NaN else PL;
lowofline.DefineColor("Color", Color.YELLOW);
lowofline.AssignValueColor(highofline.color("Color"));
lowofline.SetPaintingStrategy(PaintingStrategy.HORIZONTAL);

Shareable Link

https://tos.mx/UoIukn

Video Tutorial


Attachments

  • 2qzTplK.png
    2qzTplK.png
    194.9 KB · Views: 224
Last edited:
Ok I think I finally got it. The main timeframe on thinkorswim is just used to combine the data for the requested period. The Fibonacci is drawn only fo the period mentioned in the study settings itself and the timeframe selected on thinkorswim is used to gather data accordingly based on it. The study works rock solid and I tested with weekly, monthly, daily, and all intraday as well.
 
I have a script I took from here and modified slightly. I am trying to show bubble text on the 1H chart but data comes from the D chart. I get the right data but displayed on every hour bar. Is there a way I can make it appear only on the last bar?

AddChartBubble( barnumber, h2, concat(concat(fib2*100,"%") , concat(" $", round(h2, 2))), color.cyan, yes);

XuKHRay.png

Here are 2 methods:


This moves the last bubble to the right by the offset in the []. To move it from those offsets, increase/decrease both by the same number
Code:
def h2    = high(period = AggregationPeriod.DAY);
plot fib2 = high(period = AggregationPeriod.DAY);
AddChartBubble( IsNaN(close[1]) and !IsNaN(close[2]), h2, Concat(Concat(fib2 * 100, "%") , Concat(" $", Round(h2, 2))), Color.CYAN, yes);

This moves the bubble to the right edge. Change the highestall by increasing/decreasing BarNumber() - 1)
Code:
def h    = high(period = AggregationPeriod.DAY);
plot fib = high(period = AggregationPeriod.DAY);
AddChartBubble(barnumber()==HighestAll(BarNumber() - 1), h, Concat((fib * 100), "%"), Color.WHITE, yes);
 
Here are 2 methods:


This moves the last bubble to the right by the offset in the []. To move it from those offsets, increase/decrease both by the same number


This moves the bubble to the right edge. Change the highestall by increasing/decreasing BarNumber() - 1)
When I am on a 1H chart nothing displays with these methods. Everything works when I am on the D chart. Here is my entire code.

Code:
#
# WalkingBallista & BenTen
# [URL]https://usethinkscript.com/d/153-high-and-low-with-fibonacci-retracement-indicator-for-thinkorswim[/URL]
input aggregationPeriod = AggregationPeriod.DAY;
input ShowTodayOnly = yes;
input length = 21;

def PH = highest(high(period = aggregationPeriod),length);
def PL = lowest(low(period = aggregationPeriod),length);
def barnumber = barnumber();
def bH = if high(period = aggregationPeriod) == PH then barnumber else double.nan;
def bL = if low(period = aggregationPeriod) == PL then barnumber else double.nan;
def day = getDay();
#def month = getMonth();
def Month = if GetMonth() == GetLastMonth() then 1 else 0;
def year = getYear();
def lastDay = getLastDay();
def lastmonth = getLastMonth();
def lastyear = getLastYear();
def isToday = if(day == lastDay and month == lastmonth and year == lastyear, 1, 0);

def istodaybarnumber = Highest(if isToday then barnumber else double.nan,length);

def PO = open(period = aggregationPeriod);
def Today = if GetDay() == GetLastDay() then 1 else 0;
def Week = if GetWeek() == GetLastWeek() then 1 else 0;


input showBubble = yes;
input ShiftBubble = 50;
def n1 = ShiftBubble + 1;

def range =  PH - PL;


input fib = 1.618;
input fib1 = 1.272;
input fib2 = 0.618;
input fib3 = 0.236;
input fib4 = 0.382;
input fib5 = 0.5;
input fib6 = 0.786;
input fib7 = 2.618;


plot h;
plot h1;
plot h2;
plot h3;
plot h4;
plot h5;
plot h6;
plot h7;
plot h8;
plot h9;
plot h10;
plot highofline;
plot lowofline;


if showTodayOnly and !IsNaN(close(period = aggregationPeriod)[-1])
then {
h = Double.NaN;
h1 = Double.NaN;
h2 = Double.NaN;
h3 = Double.NaN;
h4 = Double.NaN;
h5 = Double.NaN;
h6 = Double.NaN;
h7 = Double.NaN;
h8 = Double.NaN;
h9 = Double.NaN;
h10 = Double.NaN;
highofline = Double.NaN;
lowofline = Double.NaN;
} else {


if bH > bL then {
h =  PH + range*(fib);
h1 =  PH + range*(fib1);
h2 =  PH - range*(fib2);
h3 =  PH - range*(fib3);
h4 =  PH - range*(fib4);
h5 =  PH - range*(fib5);
h6 =  PH - range*(fib6);
h7 =  PH - range*(fib7);
h8 =  PL + range*(fib1);
h9 =  PL + range*(fib);
h10 =  PL + range*(fib7);
highofline = PH;
lowofline = PL;}
else
{h =  PH + range*(fib-1);
h1 =  PH + range*(fib1-1);
h2 =  PH + range*(fib2-1);
h3 =  PH + range*(fib3-1);
h4 =  PH + range*(fib4-1);
h5 =  PH + range*(fib5-1);
h6 = PH + range*(fib6-1);
h7 = PH + range*(fib7-1);
h8 =  PL - range*(fib1-1);
h9 =  PL - range*(fib-1);
h10 =  PL - range*(fib7-1);
highofline = PH;
lowofline = PL;}

}

h.DefineColor("Color", CreateColor(50, 150, 200));
h.AssignValueColor(h.color("Color"));
h.SetPaintingStrategy(PaintingStrategy.HORIZONTAL);

h1.DefineColor("Color", Color.Magenta);
h1.AssignValueColor(h1.color("Color"));
h1.SetPaintingStrategy(PaintingStrategy.HORIZONTAL);

h2.DefineColor("Color", Color.Green);
h2.AssignValueColor(h2.color("Color"));
h2.SetPaintingStrategy(PaintingStrategy.HORIZONTAL);

h3.DefineColor("Color", Color.RED);
h3.AssignValueColor(h3.color("Color"));
h3.SetPaintingStrategy(PaintingStrategy.HORIZONTAL);

h4.DefineColor("Color", Color.Green);
h4.AssignValueColor(h4.color("Color"));
h4.SetPaintingStrategy(PaintingStrategy.HORIZONTAL);

h5.DefineColor("Color", Color.Yellow);
h5.AssignValueColor(h5.color("Color"));
h5.SetPaintingStrategy(PaintingStrategy.DASHES);

h6.DefineColor("Color", Color.Red);
h6.AssignValueColor(h6.color("Color"));
h6.SetPaintingStrategy(PaintingStrategy.HORIZONTAL);

h7.DefineColor("Color", CreateColor(100, 100, 200));
h7.AssignValueColor(h7.color("Color"));
h7.SetPaintingStrategy(PaintingStrategy.line);

h8.DefineColor("Color", Color.Magenta);
h8.AssignValueColor(h8.color("Color"));
h8.SetPaintingStrategy(PaintingStrategy.HORIZONTAL);

h9.DefineColor("Color", CreateColor(50, 150, 200));
h9.AssignValueColor(h9.color("Color"));
h9.SetPaintingStrategy(PaintingStrategy.HORIZONTAL);

h10.DefineColor("Color", CreateColor(100, 100, 200));
h10.AssignValueColor(h10.color("Color"));
h10.SetPaintingStrategy(PaintingStrategy.HORIZONTAL);


highofline.DefineColor("Color", Color.White);
highofline.AssignValueColor(highofline.color("Color"));
highofline.SetPaintingStrategy(PaintingStrategy.HORIZONTAL);


lowofline.DefineColor("Color", Color.White);
lowofline.AssignValueColor(highofline.color("Color"));
lowofline.SetPaintingStrategy(PaintingStrategy.HORIZONTAL);

#AddChartBubble( barnumber() == highestall(barnumber() - 1), h4, concat(concat(fib4*100,"%") , concat(" $", round(h4, 2))), color.green, yes);
#AddChartBubble( IsNaN(close[1]) and !IsNaN(close[2]), h4[n1], concat(concat(fib4*100,"%") , concat(" $", round(h4[n1], 2))), color.green, yes);
AddChartBubble( barnumber, lowofline[n1], concat(concat(0,"%") , concat(" $", round(lowofline[n1], 2))), color.white, yes);
AddChartBubble( barnumber, highofline[n1], concat(concat(100,"%") , concat(" $", round(highofline[n1], 2))), color.white, yes);
AddChartBubble( barnumber, h4[n1], concat(concat(fib4*100,"%") , concat(" $", round(h4[n1], 2))), color.green, yes);
AddChartBubble( barnumber, h2[n1], concat(concat(fib2*100,"%") , concat(" $", round(h2[n1], 2))), color.green, yes);
AddChartBubble( barnumber, h3[n1], concat(concat(fib3*100,"%") , concat(" $", round(h3[n1], 2))), color.red, yes);
AddChartBubble( barnumber, h5[n1], concat(concat(fib5*100,"%") , concat(" $", round(h5[n1], 2))), color.yellow, yes);
AddChartBubble( barnumber, h6[n1], concat(concat(fib6*100,"%") , concat(" $", round(h6[n1], 2))), color.red, yes);


#def cond = showBubble and isNaN(close[ShiftBubble]) and !isNaN(close[n1]) ;
#AddchartBubble(cond,barnumber+20,concat((fib2*100),"%"),color.white,yes);
#AddchartBubble(cond,h1,concat((fib1*100),"%"),color.white,yes);
#AddchartBubble(cond ,h2,concat((fib2*100),"%"),color.white,yes);
#AddchartBubble(cond ,h3,concat((fib3*100),"%"),color.white,yes);
#AddchartBubble(Today,h4,concat((fib4*100),"%"),color.white,yes);
#AddchartBubble(cond ,h5,concat((fib5*100),"%"),color.white,yes);
#AddchartBubble(cond,h7,concat((fib7*100),"%"),color.white,yes);
#AddchartBubble(cond , h8,concat((fib1*100),"%"),color.white,yes);
#AddchartBubble(cond,h9,"161.8%",color.white);
#AddchartBubble(cond,h10,concat((fib7*100),"%"),color.white,yes);
#AddchartBubble(cond,PH[n1],"100%",color.RED,yes);
#AddchartBubble(cond ,PL[n1],"0%",color.RED,yes);
#AddchartBubble(Today,h6,concat((fib6*100),"%"),color.white,yes);
#AddchartBubble(Today[-7] and (close > h7*1.05 or close < h7*.95),h7,concat((fib7*100),"%"),color.white,yes);
#AddchartBubble(Today[-7] and (close > PL or Close < h9), h8,concat((fib1*100),"%"),color.white,yes);
#AddchartBubble(Today[-7] and (close > h8 or close < h9*.95),h9,concat((fib*100),"%"),color.white,yes);
#AddchartBubble(Today[-7] and (close > h10*1.05 or close < h10*.95),h10,concat((fib7*100),"%"),color.white,yes);
#AddchartBubble(Today[-7] and (close >h1 or close < h2),PH,"100%",color.RED,yes);
#AddchartBubble(Today[-7] and (close >h3 or close < h8),PL,"0%",color.RED,yes);
 
Last edited by a moderator:
When I am on a 1H chart nothing displays with these methods. Everything works when I am on the D chart. Here is my entire code.

#
# WalkingBallista & BenTen
# https://usethinkscript.com/d/153-high-and-low-with-fibonacci-retracement-indicator-for-thinkorswim
input aggregationPeriod = AggregationPeriod.DAY;
input ShowTodayOnly = yes;
input length = 21;

def PH = highest(high(period = aggregationPeriod),length);
def PL = lowest(low(period = aggregationPeriod),length);
def barnumber = barnumber();
def bH = if high(period = aggregationPeriod) == PH then barnumber else double.nan;
def bL = if low(period = aggregationPeriod) == PL then barnumber else double.nan;
def day = getDay();
#def month = getMonth();
def Month = if GetMonth() == GetLastMonth() then 1 else 0;
def year = getYear();
def lastDay = getLastDay();
def lastmonth = getLastMonth();
def lastyear = getLastYear();
def isToday = if(day == lastDay and month == lastmonth and year == lastyear, 1, 0);

def istodaybarnumber = Highest(if isToday then barnumber else double.nan,length);

def PO = open(period = aggregationPeriod);
def Today = if GetDay() == GetLastDay() then 1 else 0;
def Week = if GetWeek() == GetLastWeek() then 1 else 0;


input showBubble = yes;
input ShiftBubble = 50;
def n1 = ShiftBubble + 1;

def range = PH - PL;


input fib = 1.618;
input fib1 = 1.272;
input fib2 = 0.618;
input fib3 = 0.236;
input fib4 = 0.382;
input fib5 = 0.5;
input fib6 = 0.786;
input fib7 = 2.618;


plot h;
plot h1;
plot h2;
plot h3;
plot h4;
plot h5;
plot h6;
plot h7;
plot h8;
plot h9;
plot h10;
plot highofline;
plot lowofline;


if showTodayOnly and !IsNaN(close(period = aggregationPeriod)[-1])
then {
h = Double.NaN;
h1 = Double.NaN;
h2 = Double.NaN;
h3 = Double.NaN;
h4 = Double.NaN;
h5 = Double.NaN;
h6 = Double.NaN;
h7 = Double.NaN;
h8 = Double.NaN;
h9 = Double.NaN;
h10 = Double.NaN;
highofline = Double.NaN;
lowofline = Double.NaN;
} else {


if bH > bL then {
h = PH + range*(fib);
h1 = PH + range*(fib1);
h2 = PH - range*(fib2);
h3 = PH - range*(fib3);
h4 = PH - range*(fib4);
h5 = PH - range*(fib5);
h6 = PH - range*(fib6);
h7 = PH - range*(fib7);
h8 = PL + range*(fib1);
h9 = PL + range*(fib);
h10 = PL + range*(fib7);
highofline = PH;
lowofline = PL;}
else
{h = PH + range*(fib-1);
h1 = PH + range*(fib1-1);
h2 = PH + range*(fib2-1);
h3 = PH + range*(fib3-1);
h4 = PH + range*(fib4-1);
h5 = PH + range*(fib5-1);
h6 = PH + range*(fib6-1);
h7 = PH + range*(fib7-1);
h8 = PL - range*(fib1-1);
h9 = PL - range*(fib-1);
h10 = PL - range*(fib7-1);
highofline = PH;
lowofline = PL;}

}

h.DefineColor("Color", CreateColor(50, 150, 200));
h.AssignValueColor(h.color("Color"));
h.SetPaintingStrategy(PaintingStrategy.HORIZONTAL);

h1.DefineColor("Color", Color.Magenta);
h1.AssignValueColor(h1.color("Color"));
h1.SetPaintingStrategy(PaintingStrategy.HORIZONTAL);

h2.DefineColor("Color", Color.Green);
h2.AssignValueColor(h2.color("Color"));
h2.SetPaintingStrategy(PaintingStrategy.HORIZONTAL);

h3.DefineColor("Color", Color.RED);
h3.AssignValueColor(h3.color("Color"));
h3.SetPaintingStrategy(PaintingStrategy.HORIZONTAL);

h4.DefineColor("Color", Color.Green);
h4.AssignValueColor(h4.color("Color"));
h4.SetPaintingStrategy(PaintingStrategy.HORIZONTAL);

h5.DefineColor("Color", Color.Yellow);
h5.AssignValueColor(h5.color("Color"));
h5.SetPaintingStrategy(PaintingStrategy.DASHES);

h6.DefineColor("Color", Color.Red);
h6.AssignValueColor(h6.color("Color"));
h6.SetPaintingStrategy(PaintingStrategy.HORIZONTAL);

h7.DefineColor("Color", CreateColor(100, 100, 200));
h7.AssignValueColor(h7.color("Color"));
h7.SetPaintingStrategy(PaintingStrategy.line);

h8.DefineColor("Color", Color.Magenta);
h8.AssignValueColor(h8.color("Color"));
h8.SetPaintingStrategy(PaintingStrategy.HORIZONTAL);

h9.DefineColor("Color", CreateColor(50, 150, 200));
h9.AssignValueColor(h9.color("Color"));
h9.SetPaintingStrategy(PaintingStrategy.HORIZONTAL);

h10.DefineColor("Color", CreateColor(100, 100, 200));
h10.AssignValueColor(h10.color("Color"));
h10.SetPaintingStrategy(PaintingStrategy.HORIZONTAL);


highofline.DefineColor("Color", Color.White);
highofline.AssignValueColor(highofline.color("Color"));
highofline.SetPaintingStrategy(PaintingStrategy.HORIZONTAL);


lowofline.DefineColor("Color", Color.White);
lowofline.AssignValueColor(highofline.color("Color"));
lowofline.SetPaintingStrategy(PaintingStrategy.HORIZONTAL);

#AddChartBubble( barnumber() == highestall(barnumber() - 1), h4, concat(concat(fib4*100,"%") , concat(" $", round(h4, 2))), color.green, yes);
#AddChartBubble( IsNaN(close[1]) and !IsNaN(close[2]), h4[n1], concat(concat(fib4*100,"%") , concat(" $", round(h4[n1], 2))), color.green, yes);
AddChartBubble( barnumber, lowofline[n1], concat(concat(0,"%") , concat(" $", round(lowofline[n1], 2))), color.white, yes);
AddChartBubble( barnumber, highofline[n1], concat(concat(100,"%") , concat(" $", round(highofline[n1], 2))), color.white, yes);
AddChartBubble( barnumber, h4[n1], concat(concat(fib4*100,"%") , concat(" $", round(h4[n1], 2))), color.green, yes);
AddChartBubble( barnumber, h2[n1], concat(concat(fib2*100,"%") , concat(" $", round(h2[n1], 2))), color.green, yes);
AddChartBubble( barnumber, h3[n1], concat(concat(fib3*100,"%") , concat(" $", round(h3[n1], 2))), color.red, yes);
AddChartBubble( barnumber, h5[n1], concat(concat(fib5*100,"%") , concat(" $", round(h5[n1], 2))), color.yellow, yes);
AddChartBubble( barnumber, h6[n1], concat(concat(fib6*100,"%") , concat(" $", round(h6[n1], 2))), color.red, yes);


#def cond = showBubble and isNaN(close[ShiftBubble]) and !isNaN(close[n1]) ;
#AddchartBubble(cond,barnumber+20,concat((fib2*100),"%"),color.white,yes);
#AddchartBubble(cond,h1,concat((fib1*100),"%"),color.white,yes);
#AddchartBubble(cond ,h2,concat((fib2*100),"%"),color.white,yes);
#AddchartBubble(cond ,h3,concat((fib3*100),"%"),color.white,yes);
#AddchartBubble(Today,h4,concat((fib4*100),"%"),color.white,yes);
#AddchartBubble(cond ,h5,concat((fib5*100),"%"),color.white,yes);
#AddchartBubble(cond,h7,concat((fib7*100),"%"),color.white,yes);
#AddchartBubble(cond , h8,concat((fib1*100),"%"),color.white,yes);
#AddchartBubble(cond,h9,"161.8%",color.white);
#AddchartBubble(cond,h10,concat((fib7*100),"%"),color.white,yes);
#AddchartBubble(cond,PH[n1],"100%",color.RED,yes);
#AddchartBubble(cond ,PL[n1],"0%",color.RED,yes);
#AddchartBubble(Today,h6,concat((fib6*100),"%"),color.white,yes);
#AddchartBubble(Today[-7] and (close > h7*1.05 or close < h7*.95),h7,concat((fib7*100),"%"),color.white,yes);
#AddchartBubble(Today[-7] and (close > PL or Close < h9), h8,concat((fib1*100),"%"),color.white,yes);
#AddchartBubble(Today[-7] and (close > h8 or close < h9*.95),h9,concat((fib*100),"%"),color.white,yes);
#AddchartBubble(Today[-7] and (close > h10*1.05 or close < h10*.95),h10,concat((fib7*100),"%"),color.white,yes);
#AddchartBubble(Today[-7] and (close >h1 or close < h2),PH,"100%",color.RED,yes);
#AddchartBubble(Today[-7] and (close >h3 or close < h8),PL,"0%",color.RED,yes);
To clarify about timeframe. When I am on the 1H timeframe but select D for my indicator input, it displays as shown above.
 
To clarify about timeframe. When I am on the 1H timeframe but select D for my indicator input, it displays as shown above.

To assist us in answering questions, it helps to post your entire code. Sometimes no one will assist you without it so that we do not waste our time.

The barnumber you used was defined as barnumber() which means it will do what you observed, it will place the bubble above each barnumber().

I have made an input n where you change the number to move the bubbles sideways. I used method 1 from above and substituted n and n1 to in place of the numbers to ease the bubble movement for all bubbles without having to modify the code.

I have left the method 2 from above active for 38.2%, so that you could see that it worked as provided. Comment it out when done viewing.

Screenshot-2022-11-03-082439.png
Ruby:
#
# WalkingBallista & BenTen
# https://usethinkscript.com/d/153-high-and-low-with-fibonacci-retracement-indicator-for-thinkorswim
input aggregationPeriod = AggregationPeriod.DAY;
input ShowTodayOnly = yes;
input length = 21;

def PH = highest(high(period = aggregationPeriod),length);
def PL = lowest(low(period = aggregationPeriod),length);
def barnumber = barnumber();
def bH = if high(period = aggregationPeriod) == PH then barnumber else double.nan;
def bL = if low(period = aggregationPeriod) == PL then barnumber else double.nan;
def day = getDay();
#def month = getMonth();
def Month = if GetMonth() == GetLastMonth() then 1 else 0;
def year = getYear();
def lastDay = getLastDay();
def lastmonth = getLastMonth();
def lastyear = getLastYear();
def isToday = if(day == lastDay and month == lastmonth and year == lastyear, 1, 0);

def istodaybarnumber = Highest(if isToday then barnumber else double.nan,length);

def PO = open(period = aggregationPeriod);
def Today = if GetDay() == GetLastDay() then 1 else 0;
def Week = if GetWeek() == GetLastWeek() then 1 else 0;


input showBubble = yes;
#input ShiftBubble = 50;
#def n1 = ShiftBubble + 1;

def range = PH - PL;


input fib = 1.618;
input fib1 = 1.272;
input fib2 = 0.618;
input fib3 = 0.236;
input fib4 = 0.382;
input fib5 = 0.5;
input fib6 = 0.786;
input fib7 = 2.618;


plot h;
plot h1;
plot h2;
plot h3;
plot h4;
plot h5;
plot h6;
plot h7;
plot h8;
plot h9;
plot h10;
plot highofline;
plot lowofline;


if showTodayOnly and !IsNaN(close(period = aggregationPeriod)[-1])
then {
h = Double.NaN;
h1 = Double.NaN;
h2 = Double.NaN;
h3 = Double.NaN;
h4 = Double.NaN;
h5 = Double.NaN;
h6 = Double.NaN;
h7 = Double.NaN;
h8 = Double.NaN;
h9 = Double.NaN;
h10 = Double.NaN;
highofline = Double.NaN;
lowofline = Double.NaN;
} else {


if bH > bL then {
h = PH + range*(fib);
h1 = PH + range*(fib1);
h2 = PH - range*(fib2);
h3 = PH - range*(fib3);
h4 = PH - range*(fib4);
h5 = PH - range*(fib5);
h6 = PH - range*(fib6);
h7 = PH - range*(fib7);
h8 = PL + range*(fib1);
h9 = PL + range*(fib);
h10 = PL + range*(fib7);
highofline = PH;
lowofline = PL;}
else
{h = PH + range*(fib-1);
h1 = PH + range*(fib1-1);
h2 = PH + range*(fib2-1);
h3 = PH + range*(fib3-1);
h4 = PH + range*(fib4-1);
h5 = PH + range*(fib5-1);
h6 = PH + range*(fib6-1);
h7 = PH + range*(fib7-1);
h8 = PL - range*(fib1-1);
h9 = PL - range*(fib-1);
h10 = PL - range*(fib7-1);
highofline = PH;
lowofline = PL;}

}

h.DefineColor("Color", CreateColor(50, 150, 200));
h.AssignValueColor(h.color("Color"));
h.SetPaintingStrategy(PaintingStrategy.HORIZONTAL);

h1.DefineColor("Color", Color.Magenta);
h1.AssignValueColor(h1.color("Color"));
h1.SetPaintingStrategy(PaintingStrategy.HORIZONTAL);

h2.DefineColor("Color", Color.Green);
h2.AssignValueColor(h2.color("Color"));
h2.SetPaintingStrategy(PaintingStrategy.HORIZONTAL);

h3.DefineColor("Color", Color.RED);
h3.AssignValueColor(h3.color("Color"));
h3.SetPaintingStrategy(PaintingStrategy.HORIZONTAL);

h4.DefineColor("Color", Color.Green);
h4.AssignValueColor(h4.color("Color"));
h4.SetPaintingStrategy(PaintingStrategy.HORIZONTAL);

h5.DefineColor("Color", Color.Yellow);
h5.AssignValueColor(h5.color("Color"));
h5.SetPaintingStrategy(PaintingStrategy.DASHES);

h6.DefineColor("Color", Color.Red);
h6.AssignValueColor(h6.color("Color"));
h6.SetPaintingStrategy(PaintingStrategy.HORIZONTAL);

h7.DefineColor("Color", CreateColor(100, 100, 200));
h7.AssignValueColor(h7.color("Color"));
h7.SetPaintingStrategy(PaintingStrategy.line);

h8.DefineColor("Color", Color.Magenta);
h8.AssignValueColor(h8.color("Color"));
h8.SetPaintingStrategy(PaintingStrategy.HORIZONTAL);

h9.DefineColor("Color", CreateColor(50, 150, 200));
h9.AssignValueColor(h9.color("Color"));
h9.SetPaintingStrategy(PaintingStrategy.HORIZONTAL);

h10.DefineColor("Color", CreateColor(100, 100, 200));
h10.AssignValueColor(h10.color("Color"));
h10.SetPaintingStrategy(PaintingStrategy.HORIZONTAL);


highofline.DefineColor("Color", Color.White);
highofline.AssignValueColor(highofline.color("Color"));
highofline.SetPaintingStrategy(PaintingStrategy.HORIZONTAL);


lowofline.DefineColor("Color", Color.White);
lowofline.AssignValueColor(highofline.color("Color"));
lowofline.SetPaintingStrategy(PaintingStrategy.HORIZONTAL);

AddChartBubble( barnumber() == highestall(barnumber() - 1), h4, concat(concat(fib4*100,"%") , concat(" $", round(h4, 2))), color.green, yes);
input n = 3;
def n1 = n+1;
#AddChartBubble(isnan(close[n]) and  !IsNaN(close[n1]), h4[n], concat(concat(fib4*100,"%") , concat(" $", round(h4[n1], 2))), color.green, yes);
AddChartBubble(isnan(close[n]) and  !IsNaN(close[n1]), lowofline[n1], concat(concat(0,"%") , concat(" $", round(lowofline[n1], 2))), color.white, yes);
AddChartBubble(  isnan(close[n]) and  !IsNaN(close[n1]), highofline[n1], concat(concat(100,"%") , concat(" $", round(highofline[n1], 2))), color.white, yes);
AddChartBubble( isnan(close[n]) and  !IsNaN(close[n1]), h4[n1], concat(concat(fib4*100,"%") , concat(" $", round(h4[n1], 2))), color.green, yes);
AddChartBubble( isnan(close[n]) and  !IsNaN(close[n1]), h2[n1], concat(concat(fib2*100,"%") , concat(" $", round(h2[n1], 2))), color.green, yes);
AddChartBubble( isnan(close[n]) and  !IsNaN(close[n1]), h3[n1], concat(concat(fib3*100,"%") , concat(" $", round(h3[n1], 2))), color.red, yes);
AddChartBubble( isnan(close[n]) and  !IsNaN(close[n1]), h5[n1], concat(concat(fib5*100,"%") , concat(" $", round(h5[n1], 2))), color.yellow, yes);
AddChartBubble( isnan(close[n]) and  !IsNaN(close[n1]), h6[n1], concat(concat(fib6*100,"%") , concat(" $", round(h6[n1], 2))), color.red, yes);


#def cond = showBubble and isNaN(close[ShiftBubble]) and !isNaN(close[n1]) ;
#AddchartBubble(cond,barnumber+20,concat((fib2*100),"%"),color.white,yes);
#AddchartBubble(cond,h1,concat((fib1*100),"%"),color.white,yes);
#AddchartBubble(cond ,h2,concat((fib2*100),"%"),color.white,yes);
#AddchartBubble(cond ,h3,concat((fib3*100),"%"),color.white,yes);
#AddchartBubble(Today,h4,concat((fib4*100),"%"),color.white,yes);
#AddchartBubble(cond ,h5,concat((fib5*100),"%"),color.white,yes);
#AddchartBubble(cond,h7,concat((fib7*100),"%"),color.white,yes);
#AddchartBubble(cond , h8,concat((fib1*100),"%"),color.white,yes);
#AddchartBubble(cond,h9,"161.8%",color.white);
#AddchartBubble(cond,h10,concat((fib7*100),"%"),color.white,yes);
#AddchartBubble(cond,PH[n1],"100%",color.RED,yes);
#AddchartBubble(cond ,PL[n1],"0%",color.RED,yes);
#AddchartBubble(Today,h6,concat((fib6*100),"%"),color.white,yes);
#AddchartBubble(Today[-7] and (close > h7*1.05 or close < h7*.95),h7,concat((fib7*100),"%"),color.white,yes);
#AddchartBubble(Today[-7] and (close > PL or Close < h9), h8,concat((fib1*100),"%"),color.white,yes);
#AddchartBubble(Today[-7] and (close > h8 or close < h9*.95),h9,concat((fib*100),"%"),color.white,yes);
#AddchartBubble(Today[-7] and (close > h10*1.05 or close < h10*.95),h10,concat((fib7*100),"%"),color.white,yes);
#AddchartBubble(Today[-7] and (close >h1 or close < h2),PH,"100%",color.RED,yes);
#AddchartBubble(Today[-7] and (close >h3 or close < h8),PL,"0%",color.RED,yes);
 
To assist us in answering questions, it helps to post your entire code. Sometimes no one will assist you without it so that we do not waste our time.

The barnumber you used was defined as barnumber() which means it will do what you observed, it will place the bubble above each barnumber().

I have made an input n where you change the number to move the bubbles sideways. I used method 1 from above and substituted n and n1 to in place of the numbers to ease the bubble movement for all bubbles without having to modify the code.

I have left the method 2 from above active for 38.2%, so that you could see that it worked as provided. Comment it out when done viewing.
Thank you this is great. One more question. Since I am basing this on a defined length, I want the retracement to flip in an uptrend. Right now it is calculating high to low no matter which one comes first.

I thought the bH > bL part would do it but I am missing something.

if bH > bL then {
h = PH + range*(fib);
h1 = PH + range*(fib1);
h2 = PH - range*(fib2);
h3 = PH - range*(fib3);
h4 = PH - range*(fib4);
h5 = PH - range*(fib5);
h6 = PH - range*(fib6);
h7 = PH - range*(fib7);
h8 = PL + range*(fib1);
h9 = PL + range*(fib);
h10 = PL + range*(fib7);
highofline = PH;
lowofline = PL;}
else
{h = PH + range*(fib-1);
h1 = PH + range*(fib1-1);
h2 = PH + range*(fib2-1);
h3 = PH + range*(fib3-1);
h4 = PH + range*(fib4-1);
h5 = PH + range*(fib5-1);
h6 = PH + range*(fib6-1);
h7 = PH + range*(fib7-1);
h8 = PL - range*(fib1-1);
h9 = PL - range*(fib-1);
h10 = PL - range*(fib7-1);
highofline = PH;
lowofline = PL;}

You have the right idea, but you needed to have those be stated as highestall. However, I was having some issues with barnumbers for PH and PL to determine the relationship of the related barnumbers to orient the fibs. So I used the thisday snippet I often use to handle this.

There is also a label that will appear if the Chart Time Interval is less than 20 days to meet your desired input length.

Screenshot-2022-11-03-160532.png

Ruby:
#
# WalkingBallista & BenTen
# https://usethinkscript.com/d/153-high-and-low-with-fibonacci-retracement-indicator-for-thinkorswim
input aggregationPeriod = AggregationPeriod.DAY;
input ShowTodayOnly     = yes;
input showBubble        = yes;
input length            = 21;

def bn = BarNumber();
def hh = high(period=aggregationPeriod);
def ll = low(period=aggregationPeriod);
def ymd      = if aggregationPeriod == aggregationPeriod.DAY
               then getday()
               else if aggregationPeriod == aggregationPeriod.WEEK
               then getweek()
               else if aggregationPeriod == aggregationPeriod.MONTH
               then getmonth()
               else getyear();
def candles  = !IsNaN(close);
def capture  = candles and ymd != ymd[1];
def dayCount = CompoundValue(1, if capture then dayCount[1] + 1 else dayCount[1], 0);
def thisDay  = (HighestAll(dayCount) - dayCount) + 1 ;

addlabel(highestall(thisday)<21, "Chart Time Interval set to " + highestall(thisday) +" days. Chart Time Interval must be set to at least 20 days");

def ph = if thisDay == 21 then hh
         else if thisDay < 21 and hh > ph[1]
         then hh else ph[1];
def pl = if bn == 1 then low
         else if thisDay == 21
         then ll
         else if thisDay < 21 and ll < pl[1]
         then ll else pl[1];
def phbar = if hh == ph then bn else Double.NaN;
def plbar = if ll  == pl then bn else Double.NaN;

#AddLabel(1, ph + " " + highestall(phbar) + " " + pl + " " + HighestAll(plbar));

def day     = GetDay();
def Month   = if GetMonth() == GetLastMonth() then 1 else 0;
def year    = GetYear();
def lastDay = GetLastDay();
def lastmonth = GetLastMonth();
def lastyear  = GetLastYear();
def isToday   = If(day == lastDay and Month == lastmonth and year == lastyear, 1, 0);

def istodaybarnumber = Highest(if isToday then bn else Double.NaN, length);

def PO    = open(period = aggregationPeriod);
def Today = if GetDay() == GetLastDay() then 1 else 0;
def Week  = if GetWeek() == GetLastWeek() then 1 else 0;

def range = ph - pl;

input fib  = 1.618;
input fib1 = 1.272;
input fib2 = 0.618;
input fib3 = 0.236;
input fib4 = 0.382;
input fib5 = 0.5;
input fib6 = 0.786;
input fib7 = 2.618;

plot h;
plot h1;
plot h2;
plot h3;
plot h4;
plot h5;
plot h6;
plot h7;
plot h8;
plot h9;
plot h10;
plot highofline;
plot lowofline;


if ShowTodayOnly and !IsNaN(close(period = aggregationPeriod)[-1])
then {
    h   = Double.NaN;
    h1  = Double.NaN;
    h2  = Double.NaN;
    h3  = Double.NaN;
    h4  = Double.NaN;
    h5  = Double.NaN;
    h6  = Double.NaN;
    h7  = Double.NaN;
    h8  = Double.NaN;
    h9  = Double.NaN;
    h10 = Double.NaN;
    highofline = Double.NaN;
    lowofline  = Double.NaN;
} else {

    if HighestAll(phbar) > HighestAll(plbar)
    then {
        h  = ph + range * (fib);
        h1 = ph + range * (fib1);
        h2 = ph - range * (fib2);
        h3 = ph - range * (fib3);
        h4 = ph - range * (fib4);
        h5 = ph - range * (fib5);
        h6 = ph - range * (fib6);
        h7 = ph - range * (fib7);
        h8 = pl + range * (fib1);
        h9 = pl + range * (fib);
        h10 = pl + range * (fib7);
        highofline = LowestAll(pl);
        lowofline  = HighestAll(ph);
    }
    else
    {
        h  = ph + range * (fib - 1);
        h1 = ph + range * (fib1 - 1);
        h2 = ph + range * (fib2 - 1);
        h3 = ph + range * (fib3 - 1);
        h4 = ph + range * (fib4 - 1);
        h5 = ph + range * (fib5 - 1);
        h6 = ph + range * (fib6 - 1);
        h7 = ph + range * (fib7 - 1);
        h8 = pl - range * (fib1 - 1);
        h9 = pl - range * (fib - 1);
        h10 = pl - range * (fib7 - 1);
        highofline = HighestAll(ph);
        lowofline  = LowestAll(pl);
    }

}

h.DefineColor("Color", CreateColor(50, 150, 200));
h.AssignValueColor(h.Color("Color"));
h.SetPaintingStrategy(PaintingStrategy.HORIZONTAL);

h1.DefineColor("Color", Color.MAGENTA);
h1.AssignValueColor(h1.Color("Color"));
h1.SetPaintingStrategy(PaintingStrategy.HORIZONTAL);

h2.DefineColor("Color", Color.GREEN);
h2.AssignValueColor(h2.Color("Color"));
h2.SetPaintingStrategy(PaintingStrategy.HORIZONTAL);

h3.DefineColor("Color", Color.RED);
h3.AssignValueColor(h3.Color("Color"));
h3.SetPaintingStrategy(PaintingStrategy.HORIZONTAL);

h4.DefineColor("Color", Color.GREEN);
h4.AssignValueColor(h4.Color("Color"));
h4.SetPaintingStrategy(PaintingStrategy.HORIZONTAL);

h5.DefineColor("Color", Color.YELLOW);
h5.AssignValueColor(h5.Color("Color"));
h5.SetPaintingStrategy(PaintingStrategy.DASHES);

h6.DefineColor("Color", Color.RED);
h6.AssignValueColor(h6.Color("Color"));
h6.SetPaintingStrategy(PaintingStrategy.HORIZONTAL);

h7.DefineColor("Color", CreateColor(100, 100, 200));
h7.AssignValueColor(h7.Color("Color"));
h7.SetPaintingStrategy(PaintingStrategy.LINE);

h8.DefineColor("Color", Color.MAGENTA);
h8.AssignValueColor(h8.Color("Color"));
h8.SetPaintingStrategy(PaintingStrategy.HORIZONTAL);

h9.DefineColor("Color", CreateColor(50, 150, 200));
h9.AssignValueColor(h9.Color("Color"));
h9.SetPaintingStrategy(PaintingStrategy.HORIZONTAL);

h10.DefineColor("Color", CreateColor(100, 100, 200));
h10.AssignValueColor(h10.Color("Color"));
h10.SetPaintingStrategy(PaintingStrategy.HORIZONTAL);


highofline.DefineColor("Color", Color.WHITE);
highofline.AssignValueColor(highofline.Color("Color"));
highofline.SetPaintingStrategy(PaintingStrategy.HORIZONTAL);


lowofline.DefineColor("Color", Color.WHITE);
lowofline.AssignValueColor(highofline.Color("Color"));
lowofline.SetPaintingStrategy(PaintingStrategy.HORIZONTAL);

input n = 3;
def n1 = n + 1;
#AddChartBubble(isnan(close[n]) and  !IsNaN(close[n1]), h4[n], concat(concat(fib4*100,"%") , concat(" $", round(h4[n1], 2))), color.green, yes);
AddChartBubble(IsNaN(close[n]) and  !IsNaN(close[n1]), lowofline[n1], Concat(Concat(0, "%") , Concat(" $", Round(lowofline[n1], 2))), Color.WHITE, yes);
AddChartBubble(  IsNaN(close[n]) and  !IsNaN(close[n1]), highofline[n1], Concat(Concat(100, "%") , Concat(" $", Round(highofline[n1], 2))), Color.WHITE, yes);
AddChartBubble( IsNaN(close[n]) and  !IsNaN(close[n1]), h4[n1], Concat(Concat(fib4 * 100, "%") , Concat(" $", Round(h4[n1], 2))), Color.GREEN, yes);
AddChartBubble( IsNaN(close[n]) and  !IsNaN(close[n1]), h2[n1], Concat(Concat(fib2 * 100, "%") , Concat(" $", Round(h2[n1], 2))), Color.GREEN, yes);
AddChartBubble( IsNaN(close[n]) and  !IsNaN(close[n1]), h3[n1], Concat(Concat(fib3 * 100, "%") , Concat(" $", Round(h3[n1], 2))), Color.RED, yes);
AddChartBubble( IsNaN(close[n]) and  !IsNaN(close[n1]), h5[n1], Concat(Concat(fib5 * 100, "%") , Concat(" $", Round(h5[n1], 2))), Color.YELLOW, yes);
AddChartBubble( IsNaN(close[n]) and  !IsNaN(close[n1]), h6[n1], Concat(Concat(fib6 * 100, "%") , Concat(" $", Round(h6[n1], 2))), Color.RED, yes);
 
Last edited:
You have the right idea, but you needed to have those be stated as highestall. However, I was having some issues with barnumbers for PH and PL to determine the relationship of the related barnumbers to orient the fibs. So I used the thisday snippet I often use to handle this.

There is also a label that will appear if the Chart Time Interval is less than 20 days to meet your desired input length.
You are awesome. I hope this is my last question. How do I extend to the right the fib lines?

Latest version is

#
# WalkingBallista & BenTen
# https://usethinkscript.com/d/153-high-and-low-with-fibonacci-retracement-indicator-for-thinkorswim
input aggregationPeriod = AggregationPeriod.DAY;
input ShowTodayOnly = yes;
input length = 21;
def hh = high(period = AggregationPeriod.DAY);
def ll = low(period = AggregationPeriod.DAY);
def day = GetDay();
def candles = !IsNaN(close);
def capture = candles and day != day[1];
def dayCount = CompoundValue(1, if capture then dayCount[1] + 1 else dayCount[1], 0);
def thisDay = (HighestAll(dayCount) - dayCount) + 1 ;

AddLabel(HighestAll(thisDay) < length, "Chart Time Interval set to " + HighestAll(thisDay) + " days. Chart Time Interval must be set to at least 20 days");
def barnumber = BarNumber();
def ph = if thisDay == length then hh
else if thisDay < length and hh > ph[1]
then hh else ph[1];
def pl = if barnumber == 1 then low
else if thisDay == length
then ll
else if thisDay < length and ll < pl[1]
then ll else pl[1];

def phbar = if hh == ph then barnumber else Double.NaN;
def plbar = if ll == pl then barnumber else Double.NaN;


def bH = if hh == ph then barnumber else Double.NaN;
def bL = if ll == pl then barnumber else Double.NaN;


#def month = getMonth();
def Month = if GetMonth() == GetLastMonth() then 1 else 0;
def year = GetYear();
def lastDay = GetLastDay();
def lastmonth = GetLastMonth();
def lastyear = GetLastYear();
def isToday = If(day == lastDay and Month == lastmonth and year == lastyear, 1, 0);

def istodaybarnumber = Highest(if isToday then barnumber else Double.NaN, length);

def PO = open(period = aggregationPeriod);
def Today = if GetDay() == GetLastDay() then 1 else 0;
def Week = if GetWeek() == GetLastWeek() then 1 else 0;


input showBubble = yes;
#input ShiftBubble = 50;
#def n1 = ShiftBubble + 1;

def range = ph - pl;
def direction;

def fib = 0.236;
def fib1 = 0.382;
def fib2 = 0.5;
def fib3 = 0.618;
def fib4 = 0.786;
def fib5 = 1.272;
def fib6 = 1.445;
def fib7 = 1.618;


plot h;
plot h1;
plot h2;
plot h3;
plot h4;
plot h5;
plot h6;
plot h7;
plot h8;
plot h9;
plot h10;
plot highofline;
plot lowofline;


if ShowTodayOnly and !IsNaN(close(period = aggregationPeriod)[-1])
then {
h = Double.NaN;
h1 = Double.NaN;
h2 = Double.NaN;
h3 = Double.NaN;
h4 = Double.NaN;
h5 = Double.NaN;
h6 = Double.NaN;
h7 = Double.NaN;
h8 = Double.NaN;
h9 = Double.NaN;
h10 = Double.NaN;
highofline = Double.NaN;
lowofline = Double.NaN;
direction = Double.NaN;
} else {


if HighestAll(bH) > HighestAll(bL)
then {
h = ph - range * (fib);
h1 = ph - range * (fib1);
h2 = ph - range * (fib2);
h3 = ph - range * (fib3);
h4 = ph - range * (fib4);
h5 = ph - range * (fib5);
h6 = ph - range * (fib6);
h7 = ph - range * (fib7);
h8 = ph + range * (fib5 - 1);
h9 = ph + range * (fib6 - 1);
h10 = ph + range * (fib7 - 1);
highofline = ph;
lowofline = pl;
direction = 1;
}
else
{
h = pl + range * (fib);
h1 = pl + range * (fib1);
h2 = pl + range * (fib2);
h3 = pl + range * (fib3);
h4 = pl + range * (fib4);
h5 = pl + range * (fib5);
h6 = pl + range * (fib6);
h7 = pl + range * (fib7);
h8 = ph + range * (fib5 - 1);
h9 = ph + range * (fib6 - 1);
h10 = ph + range * (fib7 - 1);
highofline = ph;
lowofline = pl;
direction = 0;
}

}

h5.DefineColor("Color", CreateColor(50, 150, 200));
h5.AssignValueColor(h5.Color("Color"));
h5.SetPaintingStrategy(PaintingStrategy.HORIZONTAL);

h7.DefineColor("Color", Color.MAGENTA);
h7.AssignValueColor(h1.Color("Color"));
h7.SetPaintingStrategy(PaintingStrategy.HORIZONTAL);

h2.DefineColor("Color", Color.YELLOW);
h2.AssignValueColor(h2.Color("Color"));
h2.SetPaintingStrategy(PaintingStrategy.HORIZONTAL);

h3.DefineColor("Color", Color.GREEN);
h3.AssignValueColor(h3.Color("Color"));
h3.SetPaintingStrategy(PaintingStrategy.DASHES);


h4.DefineColor("Color", Color.RED);
h4.AssignValueColor(h4.Color("Color"));
h4.SetPaintingStrategy(PaintingStrategy.HORIZONTAL);

h.DefineColor("Color", Color.RED);
h.AssignValueColor(h.Color("Color"));
h.SetPaintingStrategy(PaintingStrategy.HORIZONTAL);

h6.DefineColor("Color", Color.RED);
h6.AssignValueColor(h6.Color("Color"));
h6.SetPaintingStrategy(PaintingStrategy.HORIZONTAL);

h1.DefineColor("Color", Color.GREEN);
h1.AssignValueColor(h1.Color("Color"));
h1.SetPaintingStrategy(PaintingStrategy.DASHES);

h8.DefineColor("Color", Color.MAGENTA);
h8.AssignValueColor(h8.Color("Color"));
h8.SetPaintingStrategy(PaintingStrategy.HORIZONTAL);

h9.DefineColor("Color", CreateColor(50, 150, 200));
h9.AssignValueColor(h9.Color("Color"));
h9.SetPaintingStrategy(PaintingStrategy.HORIZONTAL);

h10.DefineColor("Color", CreateColor(100, 100, 200));
h10.AssignValueColor(h10.Color("Color"));
h10.SetPaintingStrategy(PaintingStrategy.HORIZONTAL);


highofline.DefineColor("Color", Color.WHITE);
highofline.AssignValueColor(highofline.Color("Color"));
highofline.SetPaintingStrategy(PaintingStrategy.HORIZONTAL);


lowofline.DefineColor("Color", Color.WHITE);
lowofline.AssignValueColor(highofline.Color("Color"));
lowofline.SetPaintingStrategy(PaintingStrategy.HORIZONTAL);
input n = 8;
def n1 = n + 1;

AddChartBubble(IsNaN(close[n]) and !IsNaN(close[n1]), lowofline[n1], Concat(Concat(if direction == 1 then 100 else 0, "%") , Concat(" $", Round(lowofline[n1], 2))), Color.WHITE, yes);
AddChartBubble( IsNaN(close[n]) and !IsNaN(close[n1]), highofline[n1], Concat(Concat(if direction == 0 then 100 else 0, "%") , Concat(" $", Round(highofline[n1], 2))), Color.WHITE, yes);
AddChartBubble( IsNaN(close[n]) and !IsNaN(close[n1]), h[n1], Concat(Concat(fib * 100, "%") , Concat(" $", Round(h[n1], 2))), Color.RED, yes);
AddChartBubble( IsNaN(close[n]) and !IsNaN(close[n1]), h1[n1], Concat(Concat(fib1 * 100, "%") , Concat(" $", Round(h1[n1], 2))), Color.GREEN, yes);
AddChartBubble( IsNaN(close[n]) and !IsNaN(close[n1]), h2[n1], Concat(Concat(fib2 * 100, "%") , Concat(" $", Round(h2[n1], 2))), Color.YELLOW, yes);
AddChartBubble( IsNaN(close[n]) and !IsNaN(close[n1]), h3[n1], Concat(Concat(fib3 * 100, "%") ,
Concat(" $", Round(h3[n1], 2))), Color.GREEN, yes);
AddChartBubble( IsNaN(close[n]) and !IsNaN(close[n1]), h4[n1], Concat(Concat(fib4 * 100, "%") , Concat(" $", Round(h4[n1], 2))), Color.RED, yes);

Sure, the defs for ph and pl were extended with isnan(close) code, which extended the lines to all of the fibs

[EDIT: Note that this code is different than post #16 and only applies to BTExpress's code posted in post #17 above]

Screenshot-2022-11-03-194405.png
Ruby:
#

# WalkingBallista & BenTen

# https://usethinkscript.com/d/153-high-and-low-with-fibonacci-retracement-indicator-for-thinkorswim

input aggregationPeriod = AggregationPeriod.DAY;

input ShowTodayOnly = yes;

input length = 21;

def hh = high(period = AggregationPeriod.DAY);

def ll = low(period = AggregationPeriod.DAY);

def day = GetDay();

def candles  = !IsNaN(close);

def capture  = candles and day != day[1];

def dayCount = CompoundValue(1, if capture then dayCount[1] + 1 else dayCount[1], 0);

def thisDay  = (HighestAll(dayCount) - dayCount) + 1 ;


AddLabel(HighestAll(thisDay) < length, "Chart Time Interval set to " + HighestAll(thisDay) + " days. Chart Time Interval must be set to at least 20 days");

def barnumber = BarNumber();

def ph = if isnan(close) then ph[1]

         else if thisDay == length then hh

         else if thisDay < length and hh > ph[1]

         then hh else ph[1];

def pl = if isnan(close) then pl[1]

         else if barnumber == 1 then low

         else if thisDay == length

         then ll

         else if thisDay < length and ll < pl[1]

         then ll else pl[1];


def phbar = if hh == ph then barnumber else Double.NaN;

def plbar = if ll  == pl then barnumber else Double.NaN;


def bH = if hh == ph then barnumber else Double.NaN;

def bL = if ll == pl then barnumber else Double.NaN;


#def month = getMonth();

def Month = if GetMonth() == GetLastMonth() then 1 else 0;

def year = GetYear();

def lastDay = GetLastDay();

def lastmonth = GetLastMonth();

def lastyear = GetLastYear();

def isToday = If(day == lastDay and Month == lastmonth and year == lastyear, 1, 0);


def istodaybarnumber = Highest(if isToday then barnumber else Double.NaN, length);


def PO = open(period = aggregationPeriod);

def Today = if GetDay() == GetLastDay() then 1 else 0;

def Week = if GetWeek() == GetLastWeek() then 1 else 0;


input showBubble = yes;

#input ShiftBubble = 50;

#def n1 = ShiftBubble + 1;


def range =  ph - pl;

def direction;


def fib = 0.236;

def fib1 = 0.382;

def fib2 = 0.5;

def fib3 = 0.618;

def fib4 = 0.786;

def fib5 = 1.272;

def fib6 = 1.445;

def fib7 = 1.618;


plot h;

plot h1;

plot h2;

plot h3;

plot h4;

plot h5;

plot h6;

plot h7;

plot h8;

plot h9;

plot h10;

plot highofline;

plot lowofline;


if ShowTodayOnly and !IsNaN(close(period = aggregationPeriod)[-1])

then {

    h = Double.NaN;

    h1 = Double.NaN;

    h2 = Double.NaN;

    h3 = Double.NaN;

    h4 = Double.NaN;

    h5 = Double.NaN;

    h6 = Double.NaN;

    h7 = Double.NaN;

    h8 = Double.NaN;

    h9 = Double.NaN;

    h10 = Double.NaN;

    highofline = Double.NaN;

    lowofline = Double.NaN;

    direction = Double.NaN;

} else {


    if HighestAll(bH) > HighestAll(bL)

    then {

        h =  ph - range * (fib);

        h1 =  ph - range * (fib1);

        h2 =  ph - range * (fib2);

        h3 =  ph - range * (fib3);

        h4 =  ph - range * (fib4);

        h5 =  ph - range * (fib5);

        h6 =  ph - range * (fib6);

        h7 =  ph - range * (fib7);

        h8 =  ph + range * (fib5 - 1);

        h9 =  ph + range * (fib6 - 1);

        h10 =  ph + range * (fib7 - 1);

        highofline = ph;

        lowofline = pl;

        direction = 1;

    }

    else

    {

        h =  pl + range * (fib);

        h1 =  pl + range * (fib1);

        h2 =  pl + range * (fib2);

        h3 =  pl + range * (fib3);

        h4 =  pl + range * (fib4);

        h5 =  pl + range * (fib5);

        h6 =  pl + range * (fib6);

        h7 =  pl + range * (fib7);

        h8 =  ph + range * (fib5 - 1);

        h9 =  ph + range * (fib6 - 1);

        h10 =  ph + range * (fib7 - 1);

        highofline = ph;

        lowofline = pl;

        direction = 0;

    }


}


h5.DefineColor("Color", CreateColor(50, 150, 200));

h5.AssignValueColor(h5.Color("Color"));

h5.SetPaintingStrategy(PaintingStrategy.HORIZONTAL);


h7.DefineColor("Color", Color.MAGENTA);

h7.AssignValueColor(h1.Color("Color"));

h7.SetPaintingStrategy(PaintingStrategy.HORIZONTAL);


h2.DefineColor("Color", Color.YELLOW);

h2.AssignValueColor(h2.Color("Color"));

h2.SetPaintingStrategy(PaintingStrategy.HORIZONTAL);


h3.DefineColor("Color", Color.GREEN);

h3.AssignValueColor(h3.Color("Color"));

h3.SetPaintingStrategy(PaintingStrategy.DASHES);


h4.DefineColor("Color", Color.RED);

h4.AssignValueColor(h4.Color("Color"));

h4.SetPaintingStrategy(PaintingStrategy.HORIZONTAL);


h.DefineColor("Color", Color.RED);

h.AssignValueColor(h.Color("Color"));

h.SetPaintingStrategy(PaintingStrategy.HORIZONTAL);


h6.DefineColor("Color", Color.RED);

h6.AssignValueColor(h6.Color("Color"));

h6.SetPaintingStrategy(PaintingStrategy.HORIZONTAL);


h1.DefineColor("Color", Color.GREEN);

h1.AssignValueColor(h1.Color("Color"));

h1.SetPaintingStrategy(PaintingStrategy.DASHES);


h8.DefineColor("Color", Color.MAGENTA);

h8.AssignValueColor(h8.Color("Color"));

h8.SetPaintingStrategy(PaintingStrategy.HORIZONTAL);


h9.DefineColor("Color", CreateColor(50, 150, 200));

h9.AssignValueColor(h9.Color("Color"));

h9.SetPaintingStrategy(PaintingStrategy.HORIZONTAL);


h10.DefineColor("Color", CreateColor(100, 100, 200));

h10.AssignValueColor(h10.Color("Color"));

h10.SetPaintingStrategy(PaintingStrategy.HORIZONTAL);


highofline.DefineColor("Color", Color.WHITE);

highofline.AssignValueColor(highofline.Color("Color"));

highofline.SetPaintingStrategy(PaintingStrategy.HORIZONTAL);


lowofline.DefineColor("Color", Color.WHITE);

lowofline.AssignValueColor(highofline.Color("Color"));

lowofline.SetPaintingStrategy(PaintingStrategy.HORIZONTAL);

input n = 8;

def n1 = n + 1;


AddChartBubble(IsNaN(close[n]) and  !IsNaN(close[n1]), lowofline[n1], Concat(Concat(if direction == 1 then 100 else 0, "%") , Concat(" $", Round(lowofline[n1], 2))), Color.WHITE, yes);

AddChartBubble(  IsNaN(close[n]) and  !IsNaN(close[n1]), highofline[n1], Concat(Concat(if direction == 0 then 100 else 0, "%") , Concat(" $", Round(highofline[n1], 2))), Color.WHITE, yes);

AddChartBubble( IsNaN(close[n]) and  !IsNaN(close[n1]), h[n1], Concat(Concat(fib * 100, "%") , Concat(" $", Round(h[n1], 2))), Color.RED, yes);

AddChartBubble( IsNaN(close[n]) and  !IsNaN(close[n1]), h1[n1], Concat(Concat(fib1 * 100, "%") , Concat(" $", Round(h1[n1], 2))), Color.GREEN, yes);

AddChartBubble( IsNaN(close[n]) and  !IsNaN(close[n1]), h2[n1], Concat(Concat(fib2 * 100, "%") , Concat(" $", Round(h2[n1], 2))), Color.YELLOW, yes);

AddChartBubble( IsNaN(close[n]) and  !IsNaN(close[n1]), h3[n1], Concat(Concat(fib3 * 100, "%") ,

 Concat(" $", Round(h3[n1], 2))), Color.GREEN, yes);

AddChartBubble( IsNaN(close[n]) and  !IsNaN(close[n1]), h4[n1], Concat(Concat(fib4 * 100, "%") , Concat(" $", Round(h4[n1], 2))), Color.RED, yes);
 
Last edited:
Sure, the defs for ph and pl were extended with isnan(close) code, which extended the lines to all of the fibs
Hi @SleepyZ ,
I am using the code you posted in post #18 and flipping the retracement in either an uptrend or downtrend doesn't appear to be working if you select No for "Show Today Only". Is it possible to have it flip for the previous time period aggregations? Right now, it flips all of them based on the current timeframe.
O4Hr0Uh.png
 
Last edited by a moderator:

Join useThinkScript to post your question to a community of 21,000+ developers and traders.

Not the exact question you're looking for?

Start a new thread and receive assistance from our community.

87k+ Posts
518 Online
Create Post

The Market Trading Game Changer

Join 2,500+ subscribers inside the useThinkScript VIP Membership Club
  • Exclusive indicators
  • Proven strategies & setups
  • Private Discord community
  • ‘Buy The Dip’ signal alerts
  • Exclusive members-only content
  • Add-ons and resources
  • 1 full year of unlimited support

Frequently Asked Questions

What is useThinkScript?

useThinkScript is the #1 community of stock market investors using indicators and other tools to power their trading strategies. Traders of all skill levels use our forums to learn about scripting and indicators, help each other, and discover new ways to gain an edge in the markets.

How do I get started?

We get it. Our forum can be intimidating, if not overwhelming. With thousands of topics, tens of thousands of posts, our community has created an incredibly deep knowledge base for stock traders. No one can ever exhaust every resource provided on our site.

If you are new, or just looking for guidance, here are some helpful links to get you started.

What are the benefits of VIP Membership?
VIP members get exclusive access to these proven and tested premium indicators: Buy the Dip, Advanced Market Moves 2.0, Take Profit, and Volatility Trading Range. In addition, VIP members get access to over 50 VIP-only custom indicators, add-ons, and strategies, private VIP-only forums, private Discord channel to discuss trades and strategies in real-time, customer support, trade alerts, and much more. Learn all about VIP membership here.
How can I access the premium indicators?
To access the premium indicators, which are plug and play ready, sign up for VIP membership here.
Back
Top