
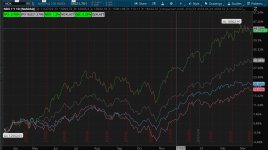
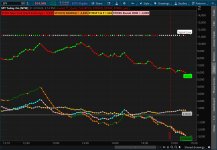
I have tried to search for a while now with no results. I am trying to setup a simple chart that has the comparison studies of the Indexes. I am trying to make the labels in grey be the Indexes current value. So far all I can get out of this is the current charts last value. I would like to get something like this tick chart but have it be price or index value. What would be more interesting if I could some how make the ups and downs of the comparison studies to show different colors. I tried to search for the comparison studies code but could not find anything.
tick chart shared link is here http://tos.mx/SiFLFR
The Code I have is this and never have been good at coding...
Input Sym = "SPX";
Input Sym2 = "NDX";
Input Sym3 = "DJX";
Input priceTypeNDX = PriceType.LAST;
def LastPriceNDX = close(priceType = priceTypeNDX);
plot DeltaOpenNDX = (LastPriceNDX - open) / open;
Input priceTypeSPX = PriceType.LAST;
def LastPriceSPX = close(Sym2, priceType = priceTypeSPX);
plot DeltaOpenSPX = (LastPriceSPX - open) / open;
Input priceTypeDJX = PriceType.LAST;
def LastPriceDJX = close(Sym3, priceType = priceTypeSPX);
plot DeltaOpenDJX = (LastPriceDJX - open) / open;
Def C = Close(Sym, AggregationPeriod.DAY);
Def C2 = Close(Sym2, AggregationPeriod.DAY);
Def C3 = Close(Sym3, AggregationPeriod.DAY);
Def Change = ((C - C[1]) / C[1]) * 100;
Def Change2 = ((C2 - C2[1]) / C2[1]) * 100;
Def Change3 = ((C3 - C3[1]) / C3[1]) * 100;
AddLabel(Yes, Sym + ": " + Round(Change,2) + "%", if Change > 0 then color.green else color.yellow);
AddLabel(yes, Sym + LastPriceSPX, if DeltaOpenSPX > open then color.dark_gray else color.light_gray);
AddLabel(Yes, Sym2 + ": " + Round(Change2,2) + "%", if Change2 > 0 then color.green else color.yellow);
AddLabel(yes, Sym2 + LastPriceNDX, if DeltaOpenNDX > open then color.dark_gray else color.light_gray);
AddLabel(Yes, Sym3 + ": " + Round(Change3,2) + "%", if Change3 > 0 then color.green else color.yellow);
AddLabel(yes, Sym3 + LastPriceDJX, if DeltaOpenDJX > open then color.dark_gray else color.light_gray);
I changed some things and now the SPX last price is showing the NDX price.
Let me know if you need some more information, any help would be great.
I made a shared link of what I have as of now. ----> https://tos.mx/!eliYXQRe
Attachments
Last edited: