#vimes - gap stas - chat discussion 2018-07-12
#only evaulates the first opening bar so set the chart to desired period
# for evaulation of gap fills in the first opening range of the chart period
declare hide_on_daily;
input mingap = 10; #hint: minimum gap to trade in pts (i.e identify gap trades of at least 6 /es pts or 10 /ym points)
input maxgap = 60;#hint: maxium gap to evaulate (filter to not analyze larger moves which might indicate bullish continuation
input usethreshold = yes;#hint: apply threshold? yes will only consider gaps less than threshold; no will evaulate every gap
def o = if GetYYYYMMDD() > GetYYYYMMDD()[1] then open else o[1];
def c = if GetYYYYMMDD() > GetYYYYMMDD()[1] then close[1] else c[1];
#helper scripts
script retrace {
input retrace_per = 0.5;
input o = open;
input c = close;
def retracement = if o > c then o - (o - c) * retrace_per else o + (c - o) * retrace_per;
plot retrace = retracement;
}
script guf {
input Gap = 1;
input tgt = close;
plot guf = if Gap and low <= tgt then 1 else 0;
plot percfill = totalsum(guf)/totalsum(gap)*100;
}
script gdf {
input gap = 1;
input tgt = close;
plot gdf = if gap and high >= tgt then 1 else 0;
plot percfill = totalsum(gdf)/totalsum(gap)*100;
}
script pts {
input gf = 1;
input tgt = close;
plot pts = if gf and open > tgt then open - tgt else if gf and open < tgt then tgt - open else 0;
def cnt = TotalSum(gf);
plot totpts = totalsum(pts);
plot avgpts = totpts / cnt;
def exc = if gf and open > tgt then high - open else if gf and open < tgt then open - low else 0;
plot avgexc = TotalSum(exc) / cnt;
plot maxexc = highestAll(exc);
}
#retrace levels
plot retrace100 = retrace(1,o,c);
plot retrace75 = retrace(0.75,o,c);
plot retrace50 = retrace(0.5, o, c);
plot retrace25 = retrace(0.25, o, c);
def retrace10 = retrace(0.1,o,c);
def newday = GetYYYYMMDD() <> GetYYYYMMDD()[1] ; #only analyzing the first bar of the day based on the chart period
def GapUP = if o > c and newday and usethreshold and o-c>=mingap and o-c<=maxgap then 1
else if o > c and newday and !usethreshold then 1 else 0;
def GapDN = if o < c and newday and usethreshold and c-o>mingap and c-o<=maxgap then 1
else if O < c and newday and !usethreshold then 1 else 0;
def cntGapUpDays = TotalSum(GapUP);
def cntGapDnDays = TotalSum(GapDN);
#50% retrace
#def guf50 = if GapUP and low <= retrace50 then 1 else 0;
def guf100 = guf(gapup,retrace100);
def guf75 = guf(gapup,retrace75);
def guf50 = guf(gapup,retrace50);
def guf25 = guf(gapup,retrace25);
def guf10 = guf(gapup,retrace10);
def gdf100 = gdf(gapdn,retrace100);
def gdf75 = gdf(gapdn,retrace75);
def gdf50 = gdf(gapdn,retrace50);
def gdf25 = gdf(gapdn,retrace25);
def gdf10 = gdf(gapdn,retrace10);
def pguf100 = guf(gapup,retrace100).percfill;
def pguf75 = guf(gapup,retrace75).percfill;
def pguf50 = guf(gapup,retrace50).percfill;
def pguf25 = guf(gapup,retrace25).percfill;
def pgdf100 = gdf(gapdn,retrace100).percfill;
def pgdf75 = gdf(gapdn,retrace75).percfill;
def pgdf50 = gdf(gapdn,retrace50).percfill;
def pgdf25 = gdf(gapdn,retrace25).percfill;
def ptsguf100 = pts(guf100, retrace100);
def totptsguf100 = pts(guf100, retrace100).totpts;
def avgptsguf100 = pts(guf100, retrace100).avgpts;
def avgexcguf100 = pts(guf100, retrace100).avgexc;
def maxexcguf100 = pts(guf100, retrace100).maxexc;
def ptsguf75 = pts(guf75, retrace75);
def totptsguf75 = pts(guf75, retrace75).totpts;
def avgptsguf75 = pts(guf75, retrace75).avgpts;
def avgexcguf75 = pts(guf75, retrace75).avgexc;
def maxexcguf75 = pts(guf75, retrace75).maxexc;
def ptsguf50 = pts(guf50, retrace50);
def totptsguf50 = pts(guf50, retrace50).totpts;
def avgptsguf50 = pts(guf50, retrace50).avgpts;
def avgexcguf50 = pts(guf50, retrace50).avgexc;
def maxexcguf50 = pts(guf50, retrace50).maxexc;
def ptsguf25 = pts(guf25, retrace25);
def totptsguf25 = pts(guf25, retrace25).totpts;
def avgptsguf25 = pts(guf25, retrace25).avgpts;
def avgexcguf25 = pts(guf25, retrace25).avgexc;
def maxexcguf25 = pts(guf25, retrace25).maxexc;
def ptsgdf100 = pts(gdf100, retrace100);
def totptsgdf100 = pts(gdf100, retrace100).totpts;
def avgptsgdf100 = pts(gdf100, retrace100).avgpts;
def avgexcgdf100 = pts(gdf100, retrace100).avgexc;
def maxexcgdf100 = pts(gdf100, retrace100).maxexc;
def ptsgdf75 = pts(gdf75, retrace75);
def totptsgdf75 = pts(gdf75, retrace75).totpts;
def avgptsgdf75 = pts(gdf75, retrace75).avgpts;
def avgexcgdf75 = pts(gdf75, retrace75).avgexc;
def maxexcgdf75 = pts(gdf75, retrace75).maxexc;
def ptsgdf50 = pts(gdf50, retrace50);
def totptsgdf50 = pts(gdf50, retrace50).totpts;
def avgptsgdf50 = pts(gdf50, retrace50).avgpts;
def avgexcgdf50 = pts(gdf50, retrace50).avgexc;
def maxexcgdf50 = pts(gdf50, retrace50).maxexc;
def ptsgdf25 = pts(gdf25, retrace25);
def totptsgdf25 = pts(gdf25, retrace25).totpts;
def avgptsgdf25 = pts(gdf25, retrace25).avgpts;
def avgexcgdf25 = pts(gdf25, retrace25).avgexc;
def maxexcgdf25 = pts(gdf25, retrace25).maxexc;
#check ladder to ladder as potential lower risk trade
def p10to25up = totalsum(guf25)/totalsum(guf10 or guf25)*100;
def p25to50up = totalsum(guf50)/totalsum(guf25 or guf50)*100;
def p50to75up = totalsum(guf75)/totalsum(guf50 or guf75)*100;
def p75to100up = totalsum(guf100)/totalsum(guf75 or guf100)*100;
def p10to25dn = totalsum(gdf25)/totalsum(gdf10 or gdf25)*100;
def p25to50dn = totalsum(gdf50)/totalsum(gdf25 or gdf50)*100;
def p50to75dn = totalsum(gdf75)/totalsum(gdf50 or gdf75)*100;
def p75to100dn = totalsum(gdf100)/totalsum(gdf75 or gdf100)*100;
def prof10to25dn = if gdf10 and gdf25 then retrace25-retrace10 else 0;
def prof25to50dn = if gdf25 and gdf50 then retrace50-retrace25 else 0;
def prof50to75dn = if gdf50 and gdf75 then retrace75-retrace50 else 0;
def prof75to100dn = if gdf75 and gdf100 then retrace100-retrace75 else 0;
def prof10to25up = if guf10 and guf25 then retrace10-retrace25 else 0;
def prof25to50up = if guf25 and guf50 then retrace25 - retrace50 else 0;
def prof50to75up = if guf50 and guf75 then retrace50 - retrace75 else 0;
def prof75to100up = if guf75 and guf100 then retrace75 - retrace100 else 0;
def c25u = totalsum(guf25);
def c50u = totalsum(guf50);
def c75u = totalsum(guf75);
def c100u = totalsum(guf100);
def ldr10to25up = totalsum(prof10to25up)/c25u;
def ldr25to50up = totalsum(prof25to50up)/c50u;
def ldr50to75up = totalsum(prof50to75up)/c75u;
def ldr75to100u = totalsum(prof75to100up)/c100u;
def c25d = totalsum(gdf25);
def c50d = totalsum(gdf50);
def c75d = totalsum(gdf75);
def c100d = totalsum(gdf100);
def ldr10to25dn = totalsum(prof10to25dn)/c25d;
def ldr25to50dn = totalsum(prof25to50dn)/c50d;
def ldr50to75dn = totalsum(prof50to75dn)/c75d;
def ldr75to100d = totalsum(prof75to100dn)/c100d;
addlabel(!usethreshold,"Considering all gaps at the open there are a total of up/down gaps =, "
+ astext(cntGapUpDays) + "/" + astext(cntgapdndays)
,color.cyan);
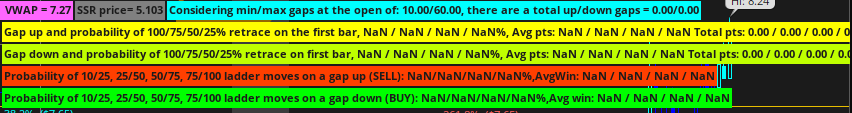
addlabel(usethreshold,"Considering min/max gaps at the open of: " + astext(mingap) + "/" + astext(maxgap)
+", there are a total up/down gaps = " + astext(cntGapUpDays) + "/" + astext(cntgapdndays)
,color.cyan);
AddLabel(yes, "Gap up and probability of 100/75/50/25% retrace on the first bar, "
+ astext(pguf100) + " / " + astext(pguf75) + " / " + astext(pguf50) + " / " + astext(pguf25)
+ "%, Avg pts: " + AsText(avgptsguf100) + " / " + AsText(avgptsguf75) + " / " + AsText(avgptsguf50) + " / " + AsText(avgptsguf25)
+ " Total pts: " + astext(totptsguf100) + " / " + astext(totptsguf75) + " / " + astext(totptsguf50) + " / " + astext(totptsguf25)
+ ", Avg negative excursion on winning trades: " + AsText(avgexcguf100) + "/" + AsText(avgexcguf75) + "/" + AsText(avgexcguf50) + "/" + AsText(avgexcguf25)
+ ", Max Neg Excursion: " + AsText(maxexcguf100)
, color = Color.yellow);
AddLabel(yes, "Gap down and probability of 100/75/50/25% retrace on first bar, "
+ astext(pgdf100) + " / " + astext(pgdf75) + " / " + astext(pgdf50) + " / " + astext(pgdf25)
+ "%, Avg pts: " + AsText(avgptsgdf100) + " / " + AsText(avgptsgdf75) + " / " + AsText(avgptsgdf50) + " / " + AsText(avgptsgdf25)
+ " Total pts: " + astext(totptsgdf100) + " / " + astext(totptsgdf75) + " / " + astext(totptsgdf50) + " / " + astext(totptsgdf25)
+ ", Avg negative excursion on winning trades: " + AsText(avgexcgdf100) + "/" + AsText(avgexcgdf75) + "/" + AsText(avgexcgdf50) + "/" + AsText(avgexcgdf25)
+ ", Max Neg Excursion: " + AsText(maxexcgdf100)
, color = Color.lime);
addlabel(yes,"Probability of 10/25, 25/50, 50/75, 75/100 ladder moves on a gap up (SELL): "
+ astext(p10to25up) + "/" + astext(p25to50up) + "/" + astext(p50to75up) + "/" + astext(p75to100up) + "%"
+ ",AvgWin: " + astext(ldr10to25dn) + " / "+ astext(ldr25to50dn) + " / "+ astext(ldr50to75dn) + " / "+ astext(ldr75to100d)
,color.light_red);
addlabel(yes,"Probability of 10/25, 25/50, 50/75, 75/100 ladder moves on a gap down (BUY): "
+ astext(p10to25dn) + "/" + astext(p25to50dn) + "/" + astext(p50to75dn) + "/" + astext(p75to100dn) + "%"
+ ",Avg win: " + astext(ldr10to25up) + " / "+ astext(ldr25to50up) + " / "+ astext(ldr50to75up) + " / "+ astext(ldr75to100u) ,color.green);