moveupwithmike
New member
Hello,
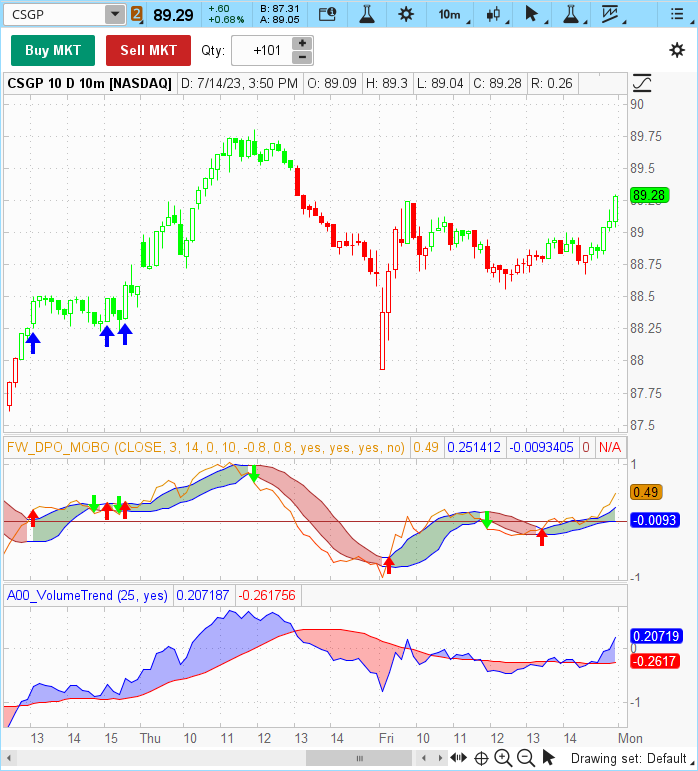
I wonder if one of our great coders can help me. I would like to combine the power of the entry signal FW_MOBO, but only when the signals are in the direction of the Volume_Based_Trend Confirmation from this site. I'm not sure if that's a strategy or indicator, but someone could me. I'd greatly appreciate it.
I wonder if one of our great coders can help me. I would like to combine the power of the entry signal FW_MOBO, but only when the signals are in the direction of the Volume_Based_Trend Confirmation from this site. I'm not sure if that's a strategy or indicator, but someone could me. I'd greatly appreciate it.
Code:
FW_MOBO_Advanced
#
# TD Ameritrade IP Company, Inc. (c) 2010-2023
#
# Source code isn't available.

input price = CLOSE;
input displace = 0;
input length = 10;
input numDevDn = -0.8;
input numDevUp = 0.8;
input fisherLen = 5;
input dpoLength = 14;
input coloredMoboLines = Yes;
input coloredMoboCloud = Yes;
input patternBreakArrows = Yes;
input fisherBreakArrows = Yes;
input playPatternSoundAlerts = No;
input playFisherSoundAlerts = No;

plot MidlineP = Double.NaN;
plot UpperBandP = Double.NaN;
plot LowerBandP = Double.NaN;
plot PatternUpArrow = Double.NaN;
plot PatternDownArrow = Double.NaN;
plot FisherUpArrow = Double.NaN;
plot FisherDownArrow = Double.NaN;


Volume_Based_Trend
# Converted to TOS from Siyeon's Tradingview "Volume Based Buy and Sell Momentum by 2tm" indicator by NPtechs

declare lower;
input ma_length = 25;
def xROC = (close - close[1]) * 100 / close;

def nRes1 = if (volume < volume[1]) then
               nRes1[1] + xROC
            else
               nRes1[1];

def nRes2 = if (volume > volume[1]) then
               nRes2[1] + xROC
            else
               nRes2[1];

def nRes3 = nRes1 + nRes2;

def nResEMA3 = simpleMovingAvg(nRes1, ma_length) + simpleMovingAvg(nRes2, ma_length);
plot PNVI = nRes3;
plot PEMA = nResEMA3;

input PaintBars = Yes;
AssignPriceColor (if !PaintBars then Color.CURRENT else if PNVI > PEMA then Color.GREEN else Color.RED);

PNVI.SetDefaultColor(GetColor(1));
PNVI.DefineColor("Up Momentum", Color.BLUE);
PNVI.AssignValueColor(PNVI.color("Up Momentum"));

PEMA.SetDefaultColor(GetColor(1));
PEMA.DefineColor("Down Momentum", Color.RED);
PEMA.AssignValueColor(PEMA.color("Down Momentum"));

AddCloud(PNVI,PEMA,PNVI.color("Up Momentum"),PEMA.color("Down Momentum"));
Last edited by a moderator: