# ---------------------------------------------------------------------------------------------------------------------
mod note:
the addorder statements were removed from this strategy as we do not post backtesting for repainting indicators
Here is an updated non-repainting version of this indicator:
https://usethinkscript.com/threads/fractal-chaos-bands-for-thinkorswim-non-repainting-version.14553/
# ---------------------------------------------------------------------------------------------------------------------
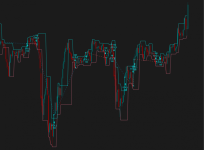
The Fractal Chaos Bands Indicator was originally coded for TradingView. It helps to identify whether the stock is trending or not. Requested for conversion to ThinkorSwim by @cherif.
Here is a quick snippet of what it does and how the Chaos Bands works:
We also added buy and sell signals into the indicator so that you can test out its potential.

Credits:
mod note:
the addorder statements were removed from this strategy as we do not post backtesting for repainting indicators
Here is an updated non-repainting version of this indicator:
https://usethinkscript.com/threads/fractal-chaos-bands-for-thinkorswim-non-repainting-version.14553/
# ---------------------------------------------------------------------------------------------------------------------
The Fractal Chaos Bands Indicator was originally coded for TradingView. It helps to identify whether the stock is trending or not. Requested for conversion to ThinkorSwim by @cherif.
Here is a quick snippet of what it does and how the Chaos Bands works:
When a market is trending, the bands will have a slope and if market is not trending the bands will flatten out. As the slope of the bands decreases, it signifies that the market is choppy, insecure and variable. As the graph becomes more and more abrupt, be it going up or down, the significance is that the market becomes trendy, or stable. Fractal Chaos Bands Indicator is used similarly to other bands-indicator (Bollinger bands for instance), offering trading opportunities when price moves above or under the fractal lines.
We also added buy and sell signals into the indicator so that you can test out its potential.
thinkScript Code
Rich (BB code):
# Chaos Bands Conversion by WalkingBallista and BenTen for cherif
# https://www.tradingview.com/script/YE3wLwsR-Fractal-Chaos-Bands-Backtest/
# https://usethinkscript.com/d/134-fractal-chaos-bands-indicator-for-thinkorswim

input sequenceCount = 1;

def maxSideLength = sequenceCount + 10;
def upRightSide = fold i1 = 1 to maxSideLength + 1 with count1 while count1 != sequenceCount and count1 != -1 do
    if GetValue(high, -i1) > high or (GetValue(high, -i1) == high and count1 == 0) then -1
    else if GetValue(high, -i1) < high then count1 + 1 else count1;
def upLeftSide = fold i2 = 1 to maxSideLength + 1 with count2 while count2 != sequenceCount and count2 != -1 do
    if GetValue(high, i2) > high or (GetValue(high, i2) == high and count2 >= 1) then -1
    else if GetValue(high, i2) < high then count2 + 1 else count2;

def downRightSide = fold i3 = 1 to maxSideLength + 1 with count3 while count3 != sequenceCount and count3 != -1 do
    if GetValue(low, -i3) < low or (GetValue(low, -i3) == low and count3 == 0) then -1
    else if GetValue(high, -i3) > low then count3 + 1 else count3;
def downLeftSide = fold i4 = 1 to maxSideLength + 1 with count4 while count4 != sequenceCount and count4 != -1 do
    if GetValue(low, i4) < low or (GetValue(low, i4) == low and count4 >= 1) then -1
    else if GetValue(low, i4) > low then count4 + 1 else count4;

def fractalUp = if upRightSide == sequenceCount and upLeftSide == sequenceCount then high else fractalUp[1];
def fractalDown = if downRightSide == sequenceCount and downLeftSide == sequenceCount then low else fractalDown[1];

plot UpFractal = fractalUp;
plot DownFractal = fractalDown;
Shareable Link
https://tos.mx/S1Z9HZCredits:
Attachments
Last edited by a moderator:

