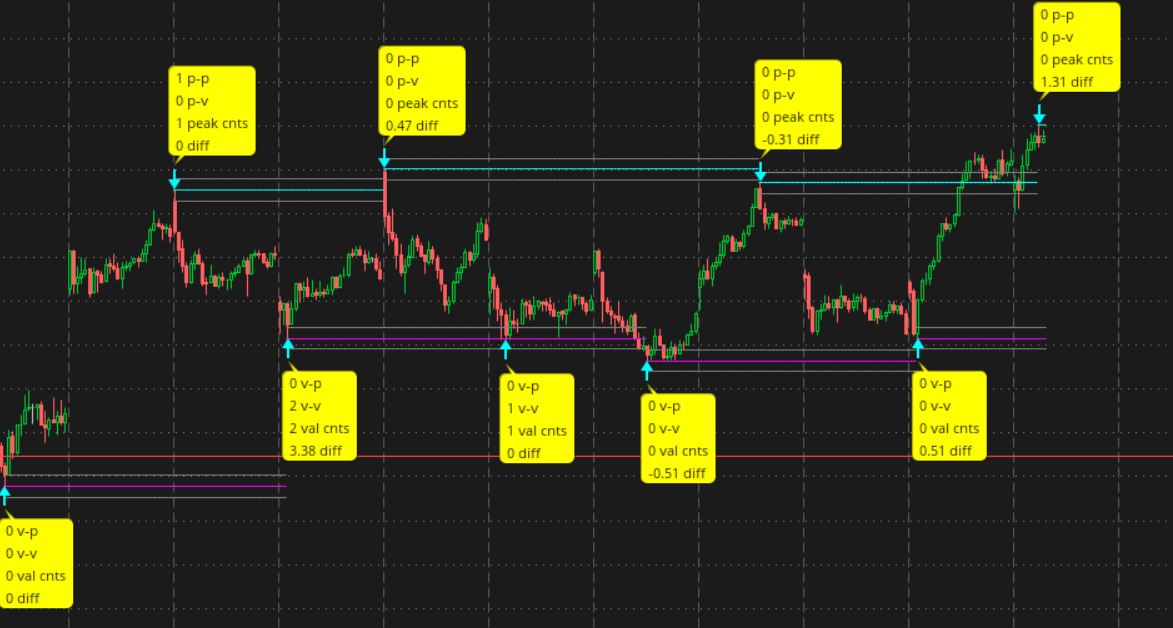
Hello, I love this program from someone else post but It shows & display too much in 30 days...180 days, I can't able see candle in the chart, It's a little bother my eyes to view. Can you able help me please to change only one day showing display ? I appreciate your time & attention this matter. Thanks. post bellow:
#
https://usethinkscript.com/threads/finding-major-pivot-points.15354/
#Finding "major" pivot points
# Find "major" pivot points
# higher time frames , day, 4hr, hr , 15m
#----------------------------
# Find "major" pivot points
# higher time frames , day, 4hr, hr , 15m
#/////////////////////////
# sub1
# peak / valley at agg time x bars
script pv {
input len = 1;
input lastbn = 1;
def na = double.nan;
def bn = BarNumber();
def offset = Min(len - 1, lastbn - bn);
#--------------------------
# valley section
#def Valley = low < Lowest(low[1], len) and low < Lowest(low[-len], len);
#def valley1 = low < Lowest(low[1], len - 1) and low == GetValue(Lowest(low, len), -offset);
def valley1;
if len == 0 then {
valley1 = 0;
} else {
valley1 = (low < Lowest(low[1], len - 1) and low == GetValue(Lowest(low, len), -offset));
}
# peak section
#def Peak = high > highest(high[1], len) and high > highest(high[-len], len);
#def peak1 = high > highest(high[1], len - 1) and high == GetValue(highest(high, len), -offset);
def peak1;
if len == 0 then {
peak1 = 0;
} else {
peak1 = (high > highest(high[1], len - 1) and high == GetValue(highest(high, len), -offset));
}
plot peak = peak1;
plot valley = valley1;
}
#/////////////////////////
#------------------------
def na = double.nan;
def bn = BarNumber();
def lastbn = highestall(if isnan(close) then 0 else bn);
def lastcls = if lastbn then close else lastcls[1];
#def lastbar = (!isnan(close) and isnan(close[-1]));
DefineGlobalColor("agg1col", getcolor(1));
DefineGlobalColor("agg2col", getcolor(5));
DefineGlobalColor("agg3col", getcolor(8));
DefineGlobalColor("agg4col", getcolor(6));
# x.SetDefaultColor(GlobalColor("xxx");
#---------------------------------
# get chart agg time
def chartagg = getaggregationperiod();
def chartmin = chartagg/(1000*60);
#---------------------------------
input agg1 = AggregationPeriod.day;
def agg1min = agg1/60000;
def min1 = if agg1min > 240 then 390 else agg1min;
def agg1ratio = min1/chartmin;
input agg1_pivot_bars = 10;
def agg1bars = roundup(agg1_pivot_bars * agg1ratio , 0);
input agg2 = AggregationPeriod.four_hours;
def agg2min = agg2/60000;
def min2 = if agg2min > 240 then 390 else agg2min;
def agg2ratio = agg2min/chartmin;
input agg2_pivot_bars = 10;
def agg2bars = roundup(agg2_pivot_bars * agg2ratio , 0);
input agg3 = AggregationPeriod.HOUR;
def agg3min = agg3/60000;
def min3 = if agg3min > 240 then 390 else agg3min;
def agg3ratio = agg3min/chartmin;
input agg3_pivot_bars = 10;
def agg3bars = roundup(agg3_pivot_bars * agg3ratio , 0);
input agg4 = AggregationPeriod.fifteen_min;
def agg4min = agg4/60000;
def min4 = if agg4min > 240 then 390 else agg4min;
def agg4ratio = agg4min/chartmin;
input agg4_pivot_bars = 10;
def agg4bars = roundup(agg4_pivot_bars * agg4ratio , 0);
input agg5 = AggregationPeriod.five_min;
def agg5min = agg5/60000;
def min5 = if agg5min > 240 then 390 else agg5min;
def agg5ratio = agg5min/chartmin;
input agg5_pivot_bars = 10;
def agg5bars = roundup(agg5_pivot_bars * agg5ratio , 0);
#------------------
input labels_period_stats = yes;
addlabel(labels_period_stats, " ", color.black);
addlabel(labels_period_stats, "chart " + chartmin + " min", color.magenta);
addlabel(agg1bars > 0 and labels_period_stats, " ", color.black);
addlabel(agg1bars > 0 and labels_period_stats, "agg 1" , color.white);
addlabel(agg1bars > 0 and labels_period_stats, min1 + " min", GlobalColor("agg1col"));
addlabel(agg1bars > 0 and labels_period_stats, "ratio " + agg1ratio, GlobalColor("agg1col"));
addlabel(agg1bars > 0 and labels_period_stats, "agg qty " + agg1_pivot_bars, GlobalColor("agg1col"));
addlabel(agg1bars > 0 and labels_period_stats, "bars " + agg1bars, GlobalColor("agg1col"));
addlabel(agg2bars > 0 and labels_period_stats, " ", color.black);
addlabel(agg2bars > 0 and labels_period_stats, "agg 2" , color.white);
addlabel(agg2bars > 0 and labels_period_stats, min2 + " min", GlobalColor("agg2col"));
addlabel(agg2bars > 0 and labels_period_stats, "ratio " + agg2ratio, GlobalColor("agg2col"));
addlabel(agg2bars > 0 and labels_period_stats, "agg qty " + agg2_pivot_bars, GlobalColor("agg2col"));
addlabel(agg2bars > 0 and labels_period_stats, "bars " + agg2bars, GlobalColor("agg2col"));
addlabel(agg3bars > 0 and labels_period_stats, " ", color.black);
addlabel(agg3bars > 0 and labels_period_stats, "agg 3" , color.white);
addlabel(agg3bars > 0 and labels_period_stats, min3 + " min", GlobalColor("agg3col"));
addlabel(agg3bars > 0 and labels_period_stats, "ratio " + agg3ratio, GlobalColor("agg3col"));
addlabel(agg3bars > 0 and labels_period_stats, "agg qty " + agg3_pivot_bars, GlobalColor("agg3col"));
addlabel(agg3bars > 0 and labels_period_stats, "bars " + agg3bars, GlobalColor("agg3col"));
addlabel(agg4bars > 0 and labels_period_stats, " ", color.black);
addlabel(agg4bars > 0 and labels_period_stats, "agg 4" , color.white);
addlabel(agg4bars > 0 and labels_period_stats, min4 + " min", GlobalColor("agg4col"));
addlabel(agg4bars > 0 and labels_period_stats, "ratio " + agg4ratio, GlobalColor("agg4col"));
addlabel(agg4bars > 0 and labels_period_stats, "agg qty " + agg4_pivot_bars, GlobalColor("agg4col"));
addlabel(agg4bars > 0 and labels_period_stats, "bars " + agg4bars, GlobalColor("agg4col"));
addlabel(agg4bars > 0 and labels_period_stats, " ", color.black);
#------------------------
# peaks_valleys_template_00c
#
https://usethinkscript.com/threads/...y-demand-zones-for-thinkorswim.172/#post-7048
# post10 robert payne
# find peaks and valleys
# length includes current bar
#def na = double.nan;
#def bn = BarNumber();
#def lastbn = highestall(if isnan(close) then 0 else bn);
#def lastcls = if lastbn then close else lastcls[1];
##def lastbar = (!isnan(close) and isnan(close[-1]));
#input len = 4;
#def offset = Min(len - 1, lastbn - bn);
##--------------------------
## valley section
##def Valley = low < Lowest(low[1], len) and low < Lowest(low[-len], len);
#def valley = low < Lowest(low[1], len - 1) and low == GetValue(Lowest(low, len), -offset);
## peak section
##def Peak = high > highest(high[1], len) and high > highest(high[-len], len);
#def peak = high > highest(high[1], len - 1) and high == GetValue(highest(high, len), -offset);
def peak1 = pv(agg1bars , lastbn).peak;
def valley1 = pv(agg1bars , lastbn).valley;
def peak2 = pv(agg2bars , lastbn).peak;
def valley2 = pv(agg2bars , lastbn).valley;
def peak3 = pv(agg3bars , lastbn).peak;
def valley3 = pv(agg3bars , lastbn).valley;
def peak4 = pv(agg4bars , lastbn).peak;
def valley4 = pv(agg4bars , lastbn).valley;
def peak5 = pv(agg5bars , lastbn).peak;
def valley5 = pv(agg5bars , lastbn).valley;
def y = 30;
def f1 = 5;
def f2 = f1 + (1*y);
def f3 = f1 + (2*y);
def f4 = f1 + (3*y);
def f5 = f1 + (4*y);
def tik = ticksize();
#---------------------------
input show_peak_valley_arrows = yes;
def spva = show_peak_valley_arrows;
plot zv1 = if spva and Valley1 then low - (f1 * tik) else na;
zv1.SetPaintingStrategy(PaintingStrategy.ARROW_UP);
zv1.SetDefaultColor(GlobalColor("agg1col"));
zv1.SetLineWeight(2);
plot zp1 = if spva and peak1 then high + (f1 * tik) else na;
zp1.SetPaintingStrategy(PaintingStrategy.ARROW_DOWN);
zp1.SetDefaultColor(GlobalColor("agg1col"));
zp1.SetLineWeight(2);
plot zv2 = if spva and Valley2 then low - (f2 * tik) else na;
zv2.SetPaintingStrategy(PaintingStrategy.ARROW_UP);
zv2.SetDefaultColor(GlobalColor("agg2col"));
zv2.SetLineWeight(2);
plot zp2 = if spva and peak2 then high + (f2 * tik) else na;
zp2.SetPaintingStrategy(PaintingStrategy.ARROW_DOWN);
zp2.SetDefaultColor(GlobalColor("agg2col"));
zp2.SetLineWeight(2);
plot zv3 = if spva and Valley3 then low - (f3 * tik) else na;
zv3.SetPaintingStrategy(PaintingStrategy.ARROW_UP);
zv3.SetDefaultColor(GlobalColor("agg3col"));
zv3.SetLineWeight(2);
plot zp3 = if spva and peak3 then high + (f3 * tik) else na;
zp3.SetPaintingStrategy(PaintingStrategy.ARROW_DOWN);
zp3.SetDefaultColor(GlobalColor("agg3col"));
zp3.SetLineWeight(2);
plot zv4 = if spva and Valley4 then low - (f4 * tik) else na;
zv4.SetPaintingStrategy(PaintingStrategy.ARROW_UP);
zv4.SetDefaultColor(GlobalColor("agg4col"));
zv4.SetLineWeight(2);
plot zp4 = if spva and peak4 then high + (f4 * tik) else na;
zp4.SetPaintingStrategy(PaintingStrategy.ARROW_DOWN);
zp4.SetDefaultColor(GlobalColor("agg4col"));
zp4.SetLineWeight(2);
plot zv5 = if spva and Valley5 then low - (f5 * tik) else na;
zv5.SetPaintingStrategy(PaintingStrategy.ARROW_UP);
zv5.SetDefaultColor(GlobalColor("agg4col"));
zv5.SetLineWeight(2);
plot zp5 = if spva and peak5 then high + (f5 * tik) else na;
zp5.SetPaintingStrategy(PaintingStrategy.ARROW_DOWN);
zp5.SetDefaultColor(GlobalColor("agg4col"));
zp5.SetLineWeight(2);
# end