Finding Trending Dips

markallenwilson1016

New member
VIP
Can any of you look at my scanner and let me know what type of changes you would make to get some more quality tickers to evaluate. I will go several days or even a week without a single stock to populate. I am trying to scan for stocks in the ttm squeeze that have just made the turn from red to yellow bars with bullish momentum. I do not want to go through too many, but would like a viable handful or dozen each day. I am part time and a novice. I am only able to check the scanner after hours or very early in the a.m. (0300 est). Thanks!

I am a Schwab user, shared links are not active yet.

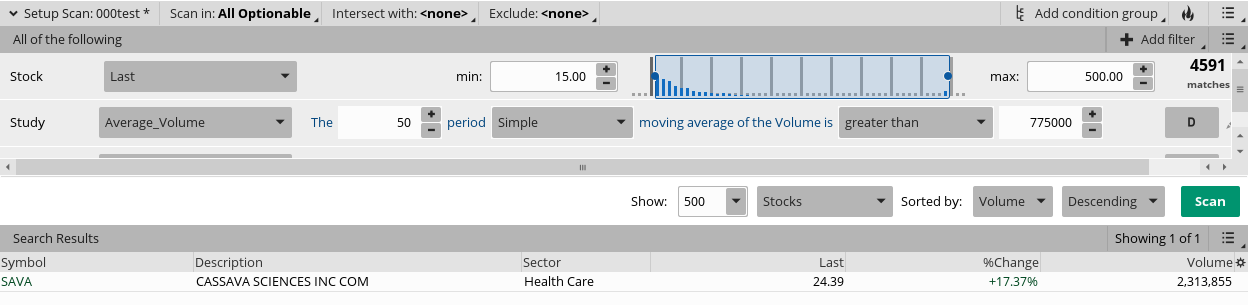
Here is an explanation of my scan:
I use a min to max last price of $1 to $500
market cap > 500 M
Volume > 300000
with script below:

TTM_Squeeze()."Histogram" is greater than TTM_Squeeze()."Histogram" from 1 bars ago
TTM_Squeeze()."Histogram" from 2 bars ago is greater than TTM_Squeeze()."Histogram" from 1 bars ago
TTM_Squeeze()."SqueezeAlert" is not equal to 0
MovAvgExponential("length" = 21)."AvgExp" is greater than MovAvgExponential("length" = 34)."AvgExp" and MovAvgExponential("length" = 8)."AvgExp" is greater than MovAvgExponential("length" = 21)."AvgExp"
TTM_Squeeze()."Histogram" is less than 0
ADX() is greater than 20

Hope that works. Never tried that before.
 
Last edited by a moderator:
Solution
You are looking for
1. very bullish trending stacked moving averages to dip enough
2. for the oscillator to go negative and
3. to recover fast enough that the averages are once again stacked, but
4. the oscillator to recover slower so it is still negative, so to provide you a point to scan for.

Generally, stocks are cyclical. They don't dip for just a couple candles.
And while stocks can fall fast, they almost never recover their stacked trending averages quickly.
It is much more common for stocks to double-bottom, build slow momentum and eventually build up to your stacked averages somewhere half-way through their trend.
Also, quality stocks will not happen with penny stocks. Consider raising the stock minimum price to $15...
You are looking for
1. very bullish trending stacked moving averages to dip enough
2. for the oscillator to go negative and
3. to recover fast enough that the averages are once again stacked, but
4. the oscillator to recover slower so it is still negative, so to provide you a point to scan for.

Generally, stocks are cyclical. They don't dip for just a couple candles.
And while stocks can fall fast, they almost never recover their stacked trending averages quickly.
It is much more common for stocks to double-bottom, build slow momentum and eventually build up to your stacked averages somewhere half-way through their trend.
Also, quality stocks will not happen with penny stocks. Consider raising the stock minimum price to $15.
Lastly, I am assuming, when you stated "volume", that you meant average volume.
And textbooks recommend average volume: 1 million
I sometimes drop down to 775,000
eqG8i9k.png


You are looking for something very specific that occurs infrequently.
Obviously, you can take out some of your filters, which will give you more results.
But not the results that you want.
My only suggestion is to change:
TTM_Squeeze()."Histogram" is less than 0
To:
TTM_Squeeze()."Histogram" is less than 0 within 6 bars
This way, if the momentum recovers as fast as price, and the oscillator is now positive, you won't miss the move. (play with the 6 bars number to see what works for you)

Sure, it is pretty when it happens! However, as you have seen, such a precise choreographed move will not be frequent.
shared chart link: http://tos.mx/rvlisXt Click here for --> Easiest way to load shared links
KdG8G0I.png


Obviously, coming off a such a huge trending week. Any type of dips will be few and far between.
 
Last edited:
Solution

Join useThinkScript to post your question to a community of 21,000+ developers and traders.

You are looking for
1. very bullish trending stacked moving averages to dip enough
2. for the oscillator to go negative and
3. to recover fast enough that the averages are once again stacked, but
4. the oscillator to recover slower so it is still negative, so to provide you a point to scan for.

Generally, stocks are cyclical. They don't dip for just a couple candles.
And while stocks can fall fast, they almost never recover their stacked trending averages quickly.
It is much more common for stocks to double-bottom, build slow momentum and eventually build up to your stacked averages somewhere half-way through their trend.
Also, quality stocks will not happen with penny stocks. Consider raising the stock minimum price to $15.
Lastly, I am assuming, when you stated "volume", that you meant average volume.
And textbooks recommend average volume: 1 million
I sometimes drop down to 775,000
eqG8i9k.png


You are looking for something very specific that occurs infrequently.
Obviously, you can take out some of your filters, which will give you more results.
But not the results that you want.
My only suggestion is to change:

To:

This way, if the momentum recovers as fast as price, and the oscillator is now positive, you won't miss the move. (play with the 6 bars number to see what works for you)

Sure, it is pretty when it happens! However, as you have seen, such a precise choreographed move will not be frequent.
shared chart link: http://tos.mx/rvlisXt Click here for --> Easiest way to load shared links
KdG8G0I.png


Obviously, coming off a such a huge trending week. Any type of dips will be few and far between.
Is it too much to request that this be made into an upper study that only shows up arrows on the chart when the condition is met?
 
Thanks so much. I will adjust and see how that works for me.
Hey dude,

I made you a simple bounce off the 200-EMA strategy to test out. It's in line with what you're trying to achieve by capitalizing on dips in the overall trend. It's just a base strategy, that you may be able to hone in on to make more accurate. It utilizes the Squeeze, to further be in line with your line of thinking here. And the way I'd manage risk is by adding the stop loss at a close below the "low EMA 200". This will cut losses fast, while letting runners run.


Code:
##Indicators

#Squeeze
input Squeezeprice = close;
input Squeezelength = 20;
input Num_Dev_Dn = -2.0;
input Num_Dev_up = 2.0;
input averageType = AverageType.SIMPLE;
input displace = 0;
def sDev = StDev(data = Squeezeprice[-displace], length = Squeezelength);
def MidLineBB = MovingAverage(averageType, data = Squeezeprice[-displace], length = Squeezelength);
def LowerBandBB = MidLineBB + Num_Dev_Dn * sDev;
def UpperBandBB = MidLineBB + Num_Dev_up * sDev;
input factorhigh = 1.0;
input factormid = 1.5;
input factorlow = 2.0;
input trueRangeAverageType = AverageType.SIMPLE;
def shifthigh = factorhigh * MovingAverage(trueRangeAverageType, TrueRange(high, close, low), Squeezelength);
def shiftMid = factormid * MovingAverage(trueRangeAverageType, TrueRange(high, close, low), Squeezelength);
def shiftlow = factorlow * MovingAverage(trueRangeAverageType, TrueRange(high, close, low), Squeezelength);
def average = MovingAverage(averageType, Squeezeprice, Squeezelength);

def Avg = average[-displace];


def UpperBandKCLow = average[-displace] + shiftlow[-displace];
def LowerBandKCLow = average[-displace] - shiftlow[-displace];

def UpperBandKCMid = average[-displace] + shiftMid[-displace];
def LowerBandKCMid = average[-displace] - shiftMid[-displace];

def UpperBandKCHigh = average[-displace] + shifthigh[-displace];
def LowerBandKCHigh = average[-displace] - shifthigh[-displace];

def K = (Highest(high, Squeezelength) + Lowest(low, Squeezelength)) /
2 + ExpAverage(close, Squeezelength);
def momo = Inertia(Squeezeprice - K / 2, Squeezelength);

def pos         = momo >= 0;
def neg         = momo < 0;
def up         = momo >= momo[1];
def dn         = momo < momo[1];


def presqueeze      = LowerBandBB > LowerBandKCLow and UpperBandBB < UpperBandKCLow;
def presqueezein    = LowerBandBB > LowerBandKCLow and UpperBandBB < UpperBandKCLow and lowerBandBB > lowerBandBB[1];
def presqueezeout   = LowerBandBB > LowerBandKCLow and UpperBandBB < UpperBandKCLow and lowerbandbb < lowerbandbb[1];

def originalSqueeze     = LowerBandBB > LowerBandKCMid and UpperBandBB < UpperBandKCMid;
def originalSqueezein   = LowerBandBB > LowerBandKCMid and UpperBandBB < UpperBandKCMid and lowerbandBB > lowerbandbb[1];
def originalSqueezeout  = LowerBandBB > LowerBandKCMid and UpperBandBB < UpperBandKCMid and lowerbandbb < lowerbandbb[1];


def ExtrSqueeze     = LowerBandBB > LowerBandKCHigh and UpperBandBB < UpperBandKCHigh;
def ExtrSqueezein   = LowerBandBB > LowerBandKCHigh and UpperBandBB < UpperBandKCHigh and lowerbandbb > lowerbandbb[1];
def ExtrSqueezeout  = LowerBandBB > LowerBandKCHigh and UpperBandBB < UpperBandKCHigh and lowerbandbb < lowerbandbb[1];


def PosUp = pos and up;
def PosDn = pos and dn;
def NegDn = neg and dn;
def NegUp = neg and up;


def squeezeline = 0;


#200 Low EMA

input Lowprice = low;
input Highprice = High;
input length = 200;


def LowAvgExp = ExpAverage(Lowprice[-displace], length);
def HighAvgExp = ExpAverage(Highprice[-displace], length);


#UniqueRSI
input src = close;#, "Source")
input smmaLength = 1;#, "SMMA length")
input rsiLength = 14;
input UpperLimit = 70;
input LowerLimit = 30;

def na = Double.NaN;
def h = high;
def l = low;
def v = volume;
def c = close;
def deltap = (src[0] - src[1]) / src[1];
def cratio = TotalSum(deltap * v);
def smma;

smma = if IsNaN(smma[1]) then SimpleMovingAvg(cratio, smmaLength) else
      (smma[1] * (smmaLength - 1) + cratio) / smmaLength;


def nRSI = RSI(Price = smma, Length = rsiLength);


##Conditions

def MAconfirmed = Lowprice > LowAvgExp;
def CrossHappens = nRSI crosses above 30;
def SecondCrossHappens = nRSI crosses above 40.55;
def PrevBarConfirmed = close < HighAvgExp within 2 bars;
def NotwrongSqueeze_1 = !extrsqueezein;
def NotwrongSqueeze_2 = !extrSqueezeout;
def NotwrongSqueeze_3 = !originalSqueezein;
def NotwrongSqueeze_4 = !originalSqueezeout;
def NotwrongSqueeze_5 = !presqueezeout;


#Plots I recommend adding a cloud to see the zone trades are being made in
#plot UpperMA = HighAvgExp;
#plot LowerMa = LowAvgExp;


##Signals

def LongScalp1 = CrossHappens
and MAconfirmed
and PrevBarConfirmed
and NotwrongSqueeze_1
and NotwrongSqueeze_2
and NotwrongSqueeze_3
and NotwrongSqueeze_4
and NotwrongSqueeze_5;

def LongScalp2 = SecondCrossHappens
and MAconfirmed
and PrevBarConfirmed
and NotwrongSqueeze_1
and NotwrongSqueeze_2
and NotwrongSqueeze_3
and NotwrongSqueeze_4
and NotwrongSqueeze_5;

##Plots

plot Long1 = if LongScalp1  then 1 else Double.NaN;
Long1.SetPaintingStrategy(PaintingStrategy.BOOLEAN_ARROW_UP);
Long1.SetDefaultColor(Color.YELLOW);

plot Long2 = if LongScalp2  then 1 else Double.NaN;
Long2.SetPaintingStrategy(PaintingStrategy.BOOLEAN_ARROW_UP);
Long2.SetDefaultColor(Color.YELLOW);
 
Last edited by a moderator:
Appreciate the look but I cannot get TOS to let me save your code. Is it intended to be used as a scanner or indicator on a chart?
You didn't provide enough information to say where you went astray.
Below is a shared chart link with the indicators already applied.

The yellow arrows seen on the chart are the result of @Bingy 's script that was contributed in this post:
https://usethinkscript.com/threads/finding-trending-dips.17402/#post-135371

The cyan arrows are my interpretation of what I believe you are looking for and were requested by @Bingy

shared chart link: http://tos.mx/yiXhUtg Click here for --> Easiest way to load shared links
OFWTyD6.png

Hope this helps!

Cyan Arrows Script:
Ruby:
def alert =
TTM_Squeeze("price" = CLOSE, "length" = 20, "nk" = 1.5, "nbb" = 2.0)."SqueezeAlert" ;

def momo =
TTM_Squeeze("price" = CLOSE, "length" = 20, "nk" = 1.5, "nbb" = 2.0) ;

plot ema8 = MovAvgExponential("length" = 8)."AvgExp" ;
plot ema21 = MovAvgExponential("length" = 21)."AvgExp" ;
plot ema34 = MovAvgExponential("length" = 34)."AvgExp" ;
plot squeez = if alert then ema34 else double.NaN ;
squeez.AssignValueColor(if ema8 <=ema21 then color.orange else color.green);
squeez.SetPaintingStrategy(PaintingStrategy.POINTS);

def zone =
if ema8 <=ema21 and momo<0 then 1 else
if ema8 >=ema21 then 0 else zone[1];

def triggered =  zone[1] and !zone and ADX()>20 ;

plot uparrow = triggered ;
uparrow.SetPaintingStrategy(PaintingStrategy.BOOLEAN_ARROW_UP);
uparrow.SetDefaultColor(color.cyan);
uparrow.SetLineWeight(3);
 
Last edited:

Similar threads

Not the exact question you're looking for?

Start a new thread and receive assistance from our community.

87k+ Posts
417 Online
Create Post

Similar threads

Similar threads

The Market Trading Game Changer

Join 2,500+ subscribers inside the useThinkScript VIP Membership Club
  • Exclusive indicators
  • Proven strategies & setups
  • Private Discord community
  • ‘Buy The Dip’ signal alerts
  • Exclusive members-only content
  • Add-ons and resources
  • 1 full year of unlimited support

Frequently Asked Questions

What is useThinkScript?

useThinkScript is the #1 community of stock market investors using indicators and other tools to power their trading strategies. Traders of all skill levels use our forums to learn about scripting and indicators, help each other, and discover new ways to gain an edge in the markets.

How do I get started?

We get it. Our forum can be intimidating, if not overwhelming. With thousands of topics, tens of thousands of posts, our community has created an incredibly deep knowledge base for stock traders. No one can ever exhaust every resource provided on our site.

If you are new, or just looking for guidance, here are some helpful links to get you started.

What are the benefits of VIP Membership?
VIP members get exclusive access to these proven and tested premium indicators: Buy the Dip, Advanced Market Moves 2.0, Take Profit, and Volatility Trading Range. In addition, VIP members get access to over 50 VIP-only custom indicators, add-ons, and strategies, private VIP-only forums, private Discord channel to discuss trades and strategies in real-time, customer support, trade alerts, and much more. Learn all about VIP membership here.
How can I access the premium indicators?
To access the premium indicators, which are plug and play ready, sign up for VIP membership here.
Back
Top