/ES Futures Trading Strategy on ThinkorSwim

Status
Not open for further replies.
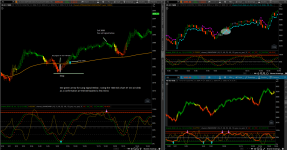
@skynetgen Can you send a link to the chart like your set up
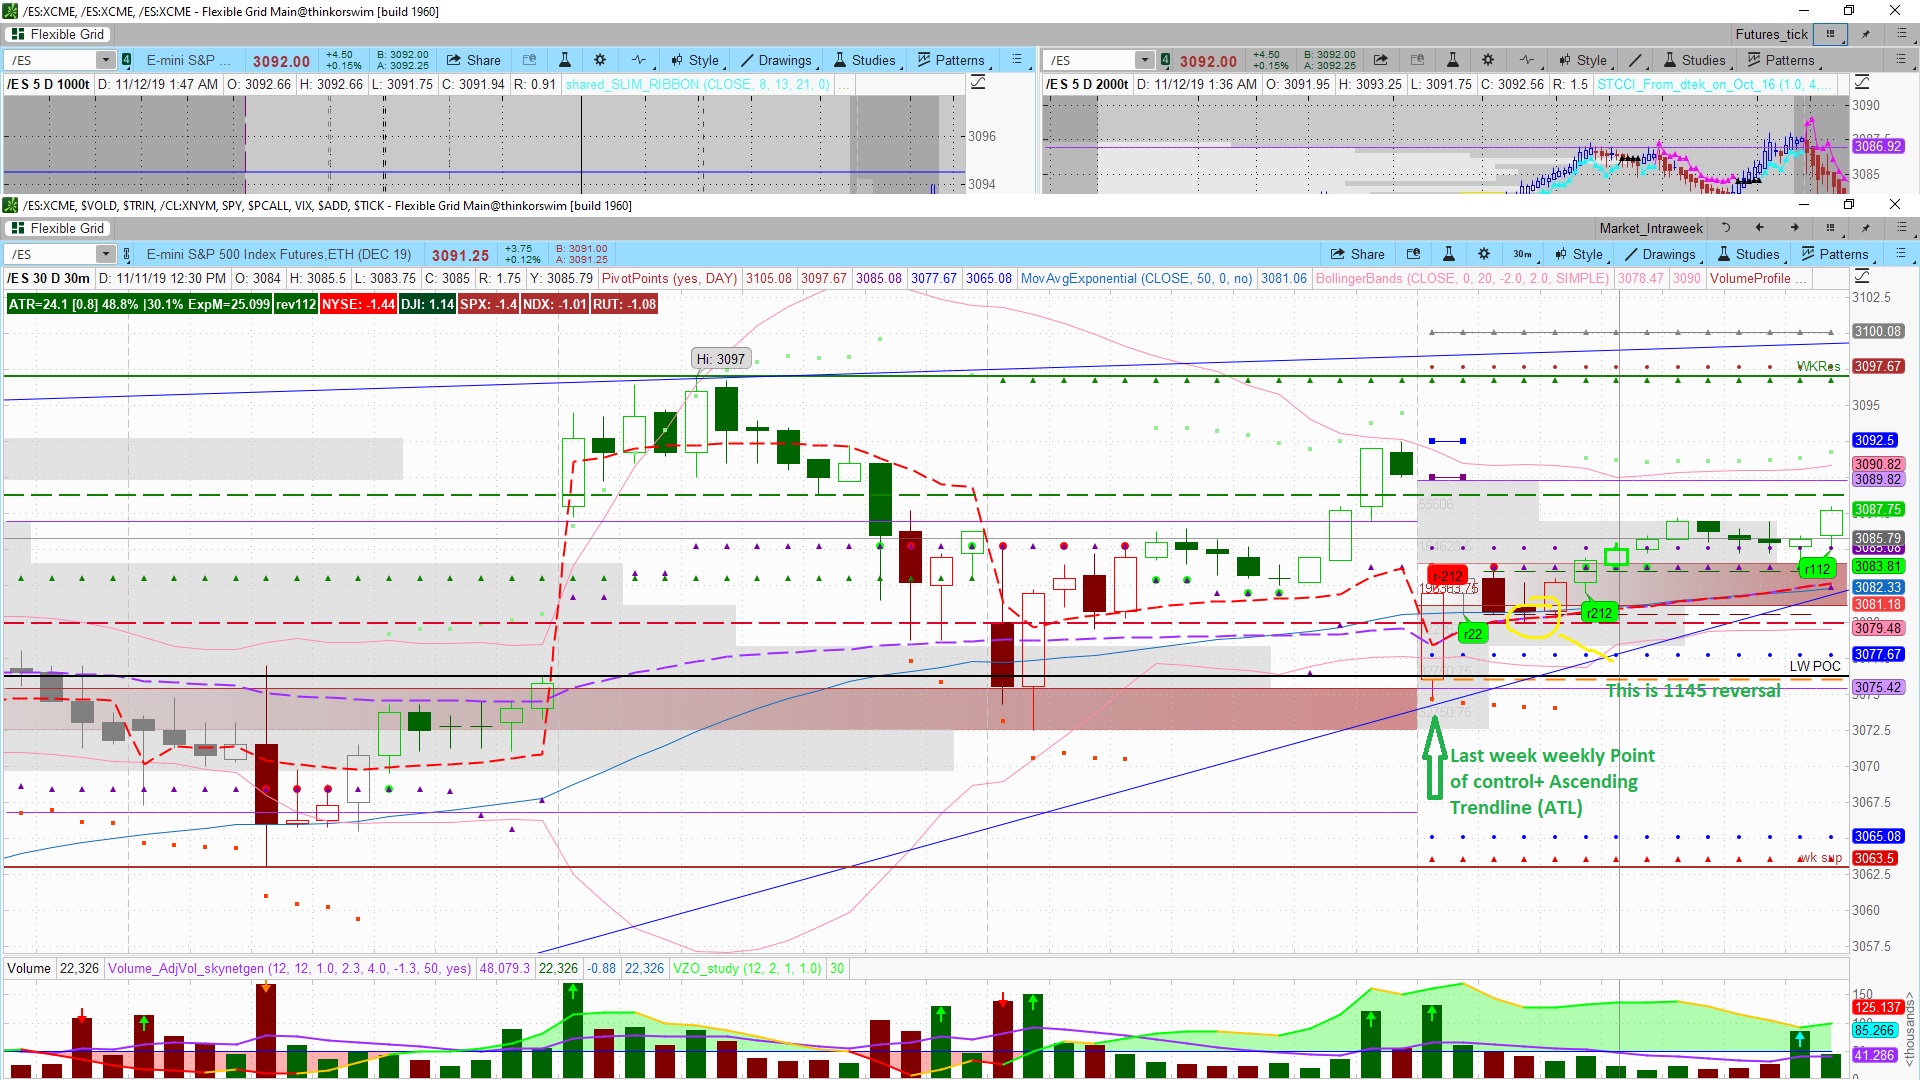
IT is the chart setup black posted. I only changed personal layout preference (like colors and such). The MFO study in this thread I posted above. The only new thing here is volume profile : daily on 1000t and weekly on 2000t. its a built-in TOS study

Its not that I mind sharing it. ITs just I believe it would lead to confusion. The blakecmathis settings is original one and the one I am working with. When/if I figure out a way to meaningfully improve on his setup I will post it here. but the personal tweaks over his clean setup might be counterproductive
 

Ben's Swing Trading Strategy + Indicator

I wouldn't call this a course. My goal is zero fluff. I will jump right into my current watchlist, tell you the ThinkorSwim indicator that I'm using, and past trade setups to help you understand my swing trading strategy.

I'm Interested

Join useThinkScript to post your question to a community of 21,000+ developers and traders.

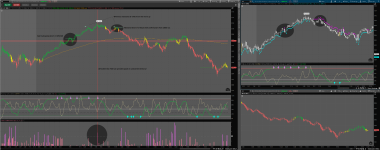
Made some minor changes on the 1000t chart to help clean up the lower studies a bit and remove the over-abundance of dashed-line levels. Just a matter of personal preference. I like keeping my charts simple and clean.

https://tos.mx/WX94HLh
j5dDjK8.png
 

Attachments

  • j5dDjK8.png
    j5dDjK8.png
    264.1 KB · Views: 255
Thanks for sharing this strategy. I’ve been practicing in sim however once backtested I would be using ETF equivalent ; SPY.
Right now I’m just keeping SPY (1 minute) up In bottom right instead of the shorter tick chart for trade execution since free commissions. I use mainly the 1000 tick /ES for trade decisions.

Anything wrong with trading the ETF versus /ES future contract intraday? They seem to mirror each other extremely closely.
 
@traderintheroom I've had success in the past using that same setup man. The one reason I moved away from it was because they mirror each other so closely, that I felt like I wasn't getting much out of it. And on a few occasions I got burned trading ES on SPY signals.
 
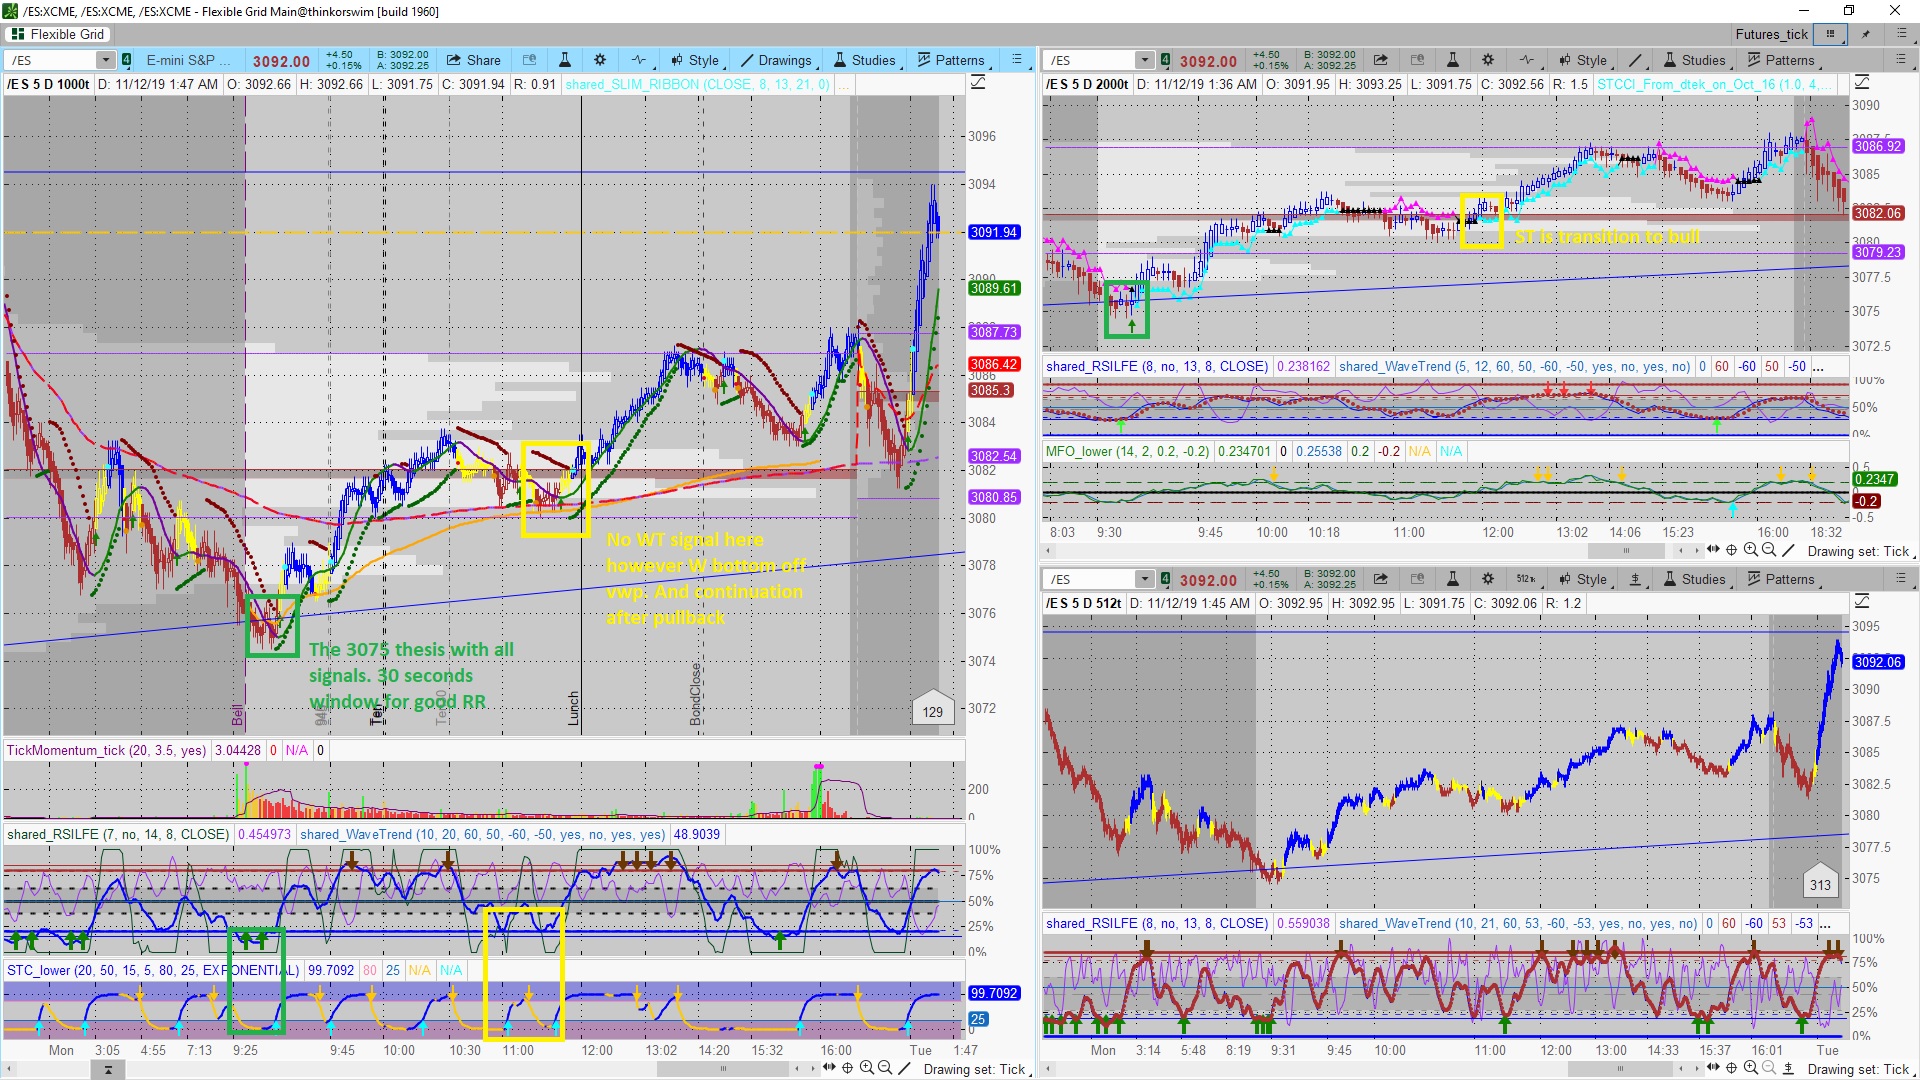
Was not trading /ES on monday due to the low range/low volume setup. However I did do thesis and in retrospect it was correct. Spent some time analyzing the signals and trying to improve. Finding a good oscillator to compliment wave trend so far was not successful. Just turning on RSI display is the simplest way you can add oscillator if you want more signals. However I believe less signals is better- more reliable is what we want

So far my conclusion are :
  • Respect wave trend signals on 1000t, but dont jump on it right away -that signal is often early (which is good btw) -wait for clarity in price action
  • Do not go against 2000t STCCI. MFO on 2000t is not very usefull. WT on 2000t is ok as confirmation
  • PSAR with 0.01 acceleration factor is decent additional confirmation and stop line .
  • Volume profile is very useful on tick chart (just like everywhere else imho).

5g0jPIP.jpg
 
Last edited:
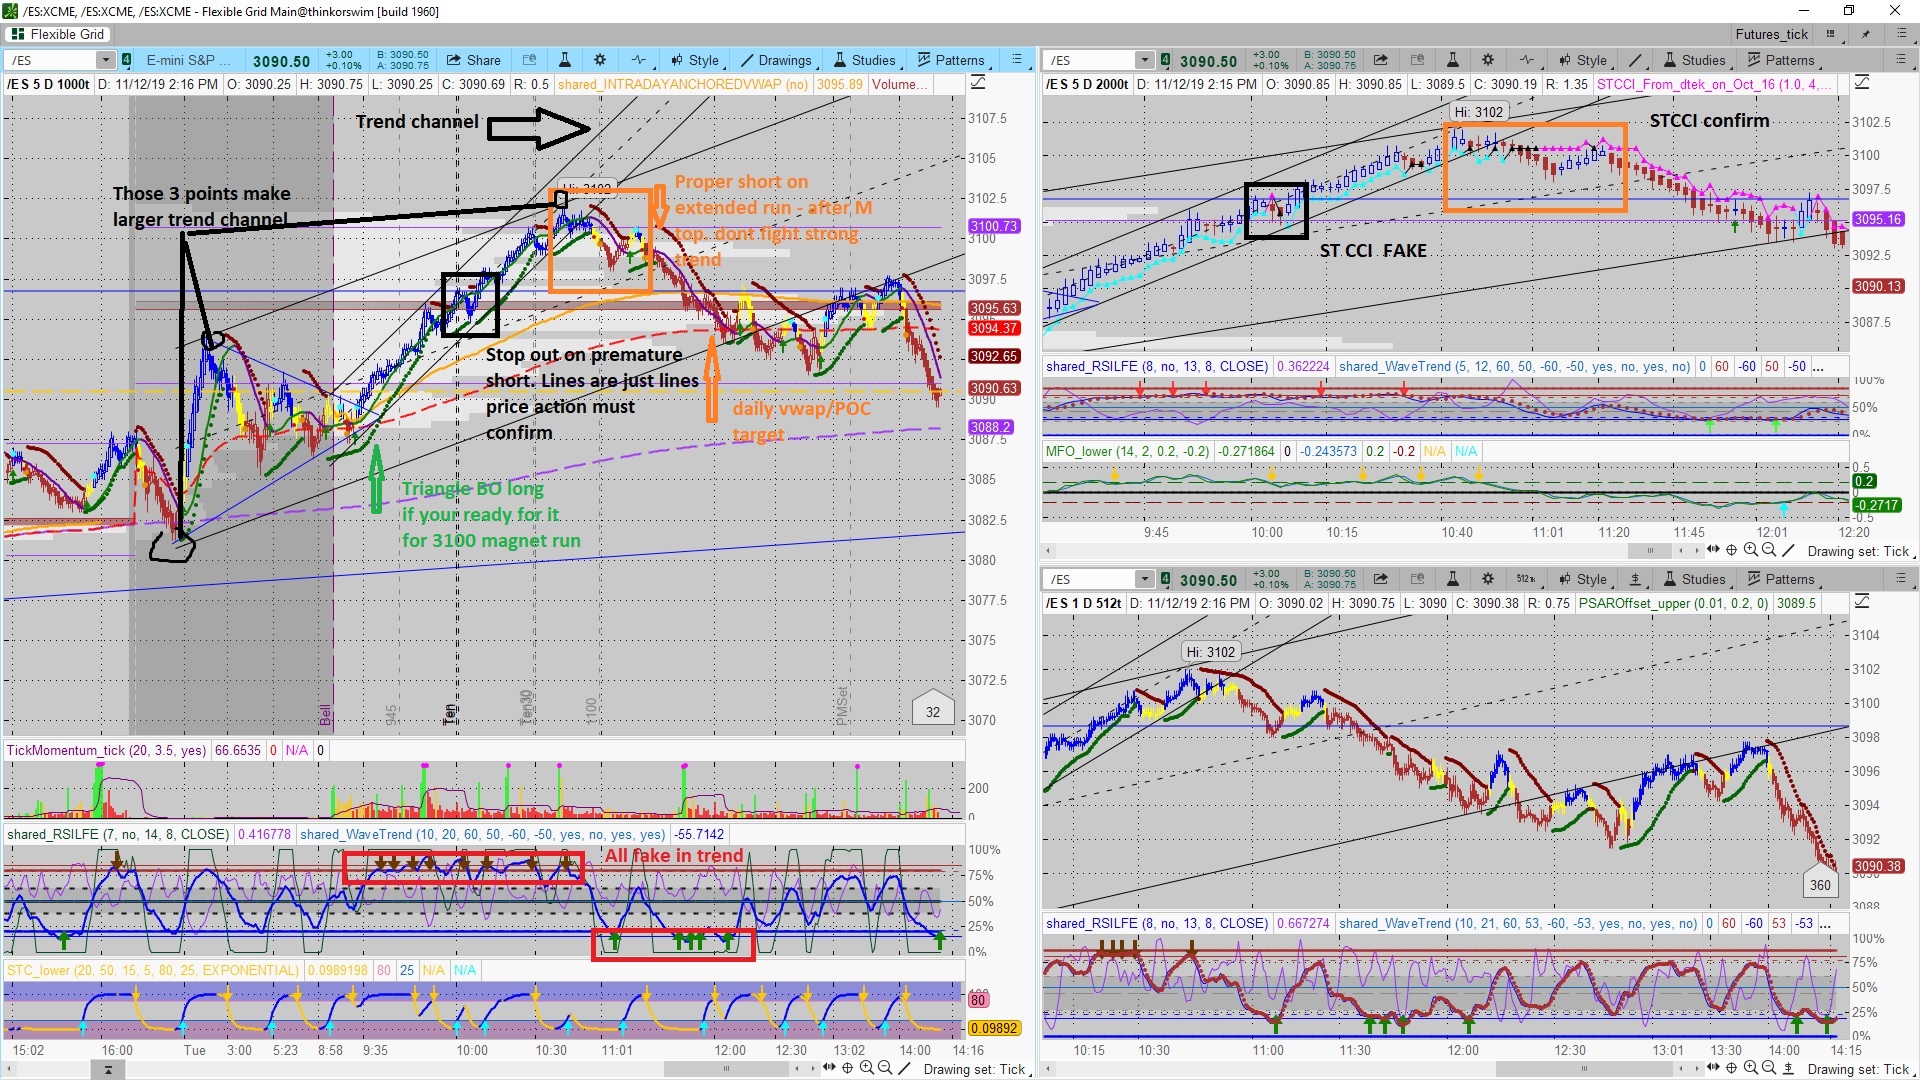
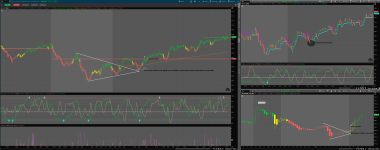
Was busy today with a gapper play I tracked from the open. So my /ES attention and focus suffered and so did the /ES scalp results. I did not capitalize on the open BO, got stopped out on first short and closed prematurely 2nd short (to get break even on /ES) . - This is example how lack of focus can fail you even if you 100% correct technically.

However I think today was extremely interesting day for analysis as it was trending day both ways Unlike previous days which were of ranged character. It highlights important of using confirmation om 2000t and not just blindly knee jerking on first signal

9O5UljT.jpg
 
Had a little voice in my head from @skynetgen saying "CCI confirmation" all morning and it kept me out of some false signals and bad positions. I did go short at 3096.50 (risky, just bad overall) and bailed after taking an even point. I cant tell you why I exited, just a gut feeling. After entering short @ 3100.25 I panicked with the support @ 3098.50 and exited my position. Clearly I should have held. Gotta become more disciplined and let my winning trades win.

yQVMHhx.png
 

Attachments

  • yQVMHhx.png
    yQVMHhx.png
    359 KB · Views: 265
Was busy today with a gapper play I tracked from the open. So my /ES attention and focus suffered and so did the /ES scalp results. I did not capitalize on the open BO, got stopped out on first short and closed prematurely 2nd short (to get break even on /ES) . - This is example how lack of focus can fail you even if you 100% correct technically.

However I think today was extremely interesting day for analysis as it was trending day both ways Unlike previous days which were of ranged character. It highlights important of using confirmation om 2000t and not just blindly knee jerking on first signal

9O5UljT.jpg
@skynetgen thank you for your analysis. It's helping me learn. I have one question though, did you draw the Trend Channel lines by hand or is that an indicator? If it's an indicator do mind sharing just that indicator? Thanks so much.
 
@skynetgen thank you for your analysis. It's helping me learn. I have one question though, did you draw the Trend Channel lines by hand or is that an indicator? If it's an indicator do mind sharing just that indicator? Thanks so much.
Its a drawing tool in TOS. It helps to draw channel off 3 points - but you have to give it 3 points
 
I have been tweaking with the settings today attempting to use SPY vs. /ES without great success. Far less trade signals. Any ideas how to covert to use SPY?
 
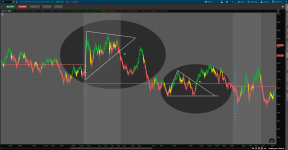
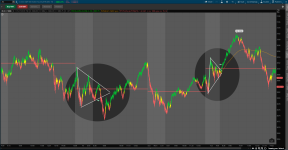
I don't wanna be Captain Hindsight or anything but these ascending, descending, and symmetrical triangle formations occur almost every single day with ES. I wasn't aware of this pattern until @skynetgen mentioned it today. Time to add a tool to the toolbox. Seems to be a pretty good indicator of a breakout.

uNXyg0A.png


8qi5Yid.png
 

Attachments

  • 8qi5Yid.png
    8qi5Yid.png
    173.6 KB · Views: 211
  • uNXyg0A.png
    uNXyg0A.png
    178 KB · Views: 204
Status
Not open for further replies.

New Indicator: Buy the Dip

Check out our Buy the Dip indicator and see how it can help you find profitable swing trading ideas. Scanner, watchlist columns, and add-ons are included.

Download the indicator

Not the exact question you're looking for?

Start a new thread and receive assistance from our community.

87k+ Posts
370 Online
Create Post

The Market Trading Game Changer

Join 2,500+ subscribers inside the useThinkScript VIP Membership Club
  • Exclusive indicators
  • Proven strategies & setups
  • Private Discord community
  • ‘Buy The Dip’ signal alerts
  • Exclusive members-only content
  • Add-ons and resources
  • 1 full year of unlimited support

Frequently Asked Questions

What is useThinkScript?

useThinkScript is the #1 community of stock market investors using indicators and other tools to power their trading strategies. Traders of all skill levels use our forums to learn about scripting and indicators, help each other, and discover new ways to gain an edge in the markets.

How do I get started?

We get it. Our forum can be intimidating, if not overwhelming. With thousands of topics, tens of thousands of posts, our community has created an incredibly deep knowledge base for stock traders. No one can ever exhaust every resource provided on our site.

If you are new, or just looking for guidance, here are some helpful links to get you started.

What are the benefits of VIP Membership?
VIP members get exclusive access to these proven and tested premium indicators: Buy the Dip, Advanced Market Moves 2.0, Take Profit, and Volatility Trading Range. In addition, VIP members get access to over 50 VIP-only custom indicators, add-ons, and strategies, private VIP-only forums, private Discord channel to discuss trades and strategies in real-time, customer support, trade alerts, and much more. Learn all about VIP membership here.
How can I access the premium indicators?
To access the premium indicators, which are plug and play ready, sign up for VIP membership here.
Back
Top