blakecmathis
Well-known member
⚠ This thread has exhausted its substantive discussion of this indicator so it has been locked ⚠
This thread is still available for reading.
If looking for specific information in this thread,
here is a great hack for searching many-paged threads.
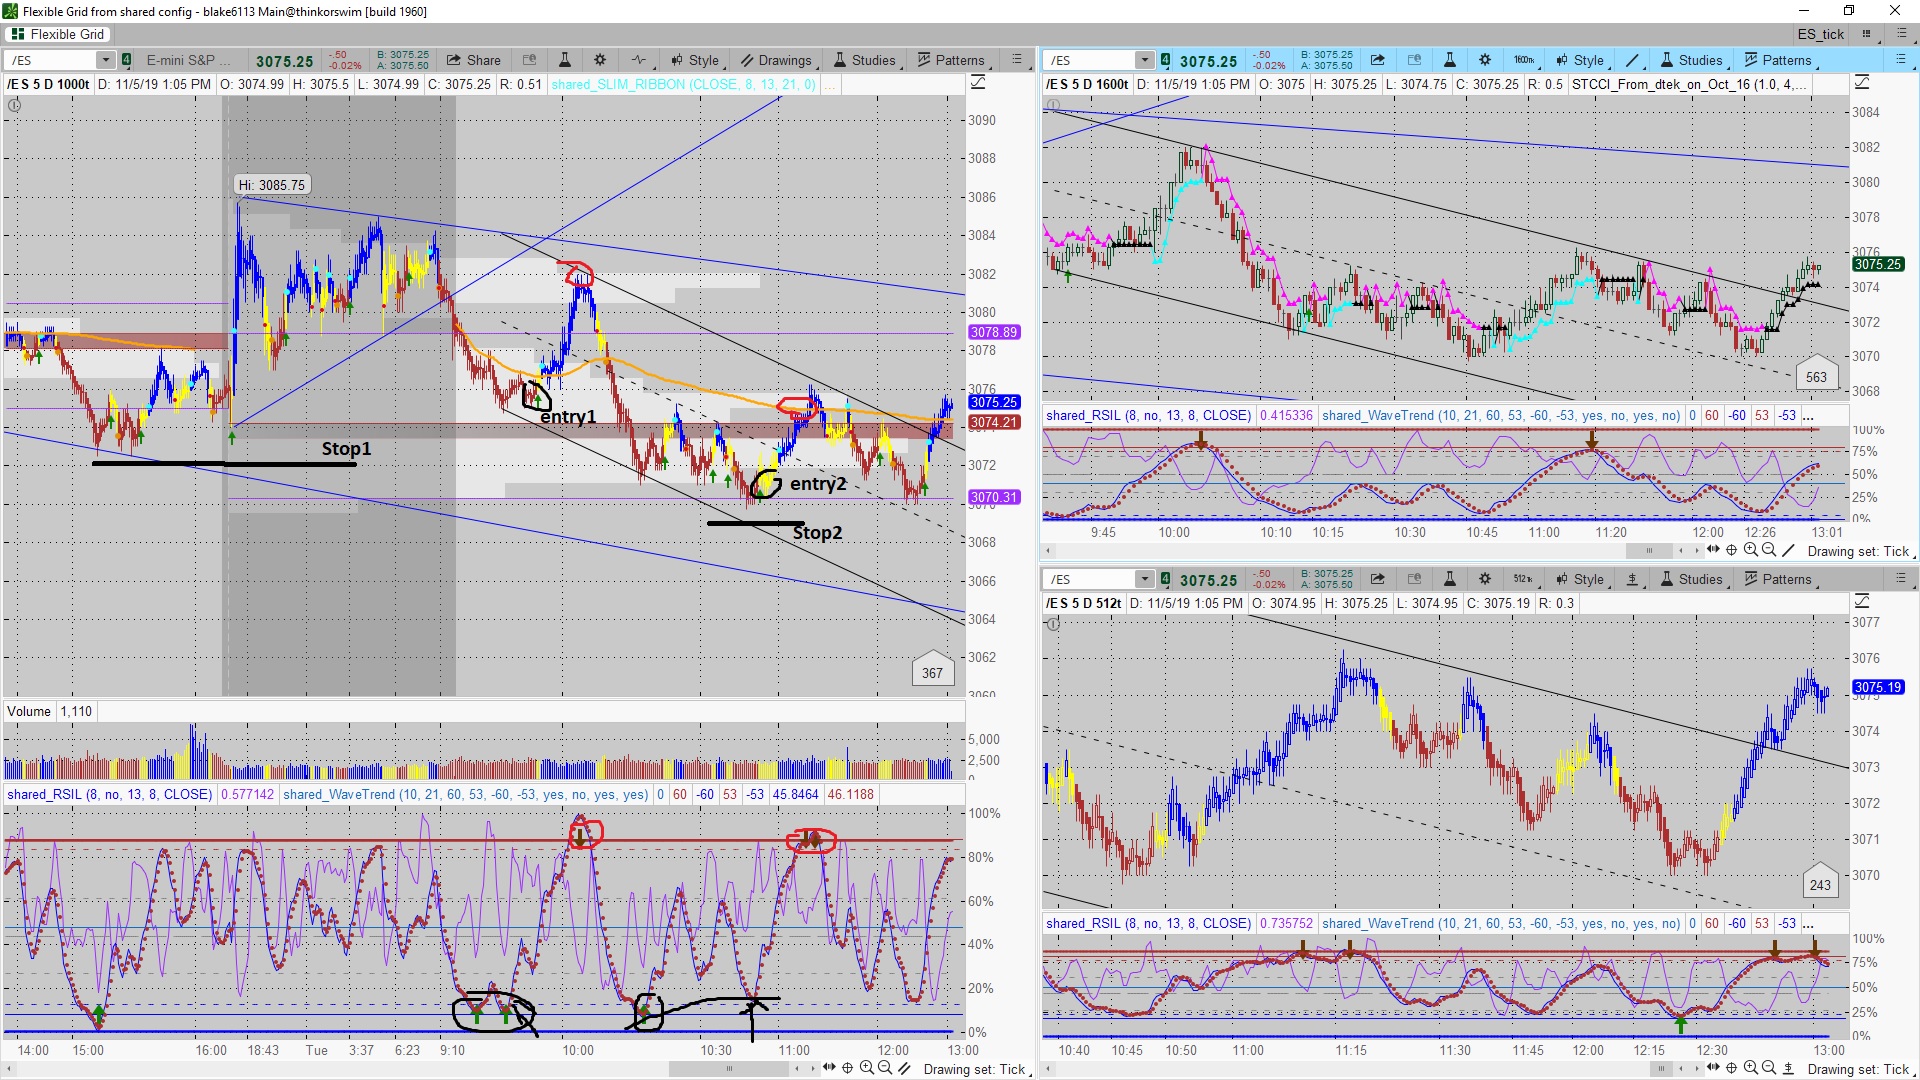
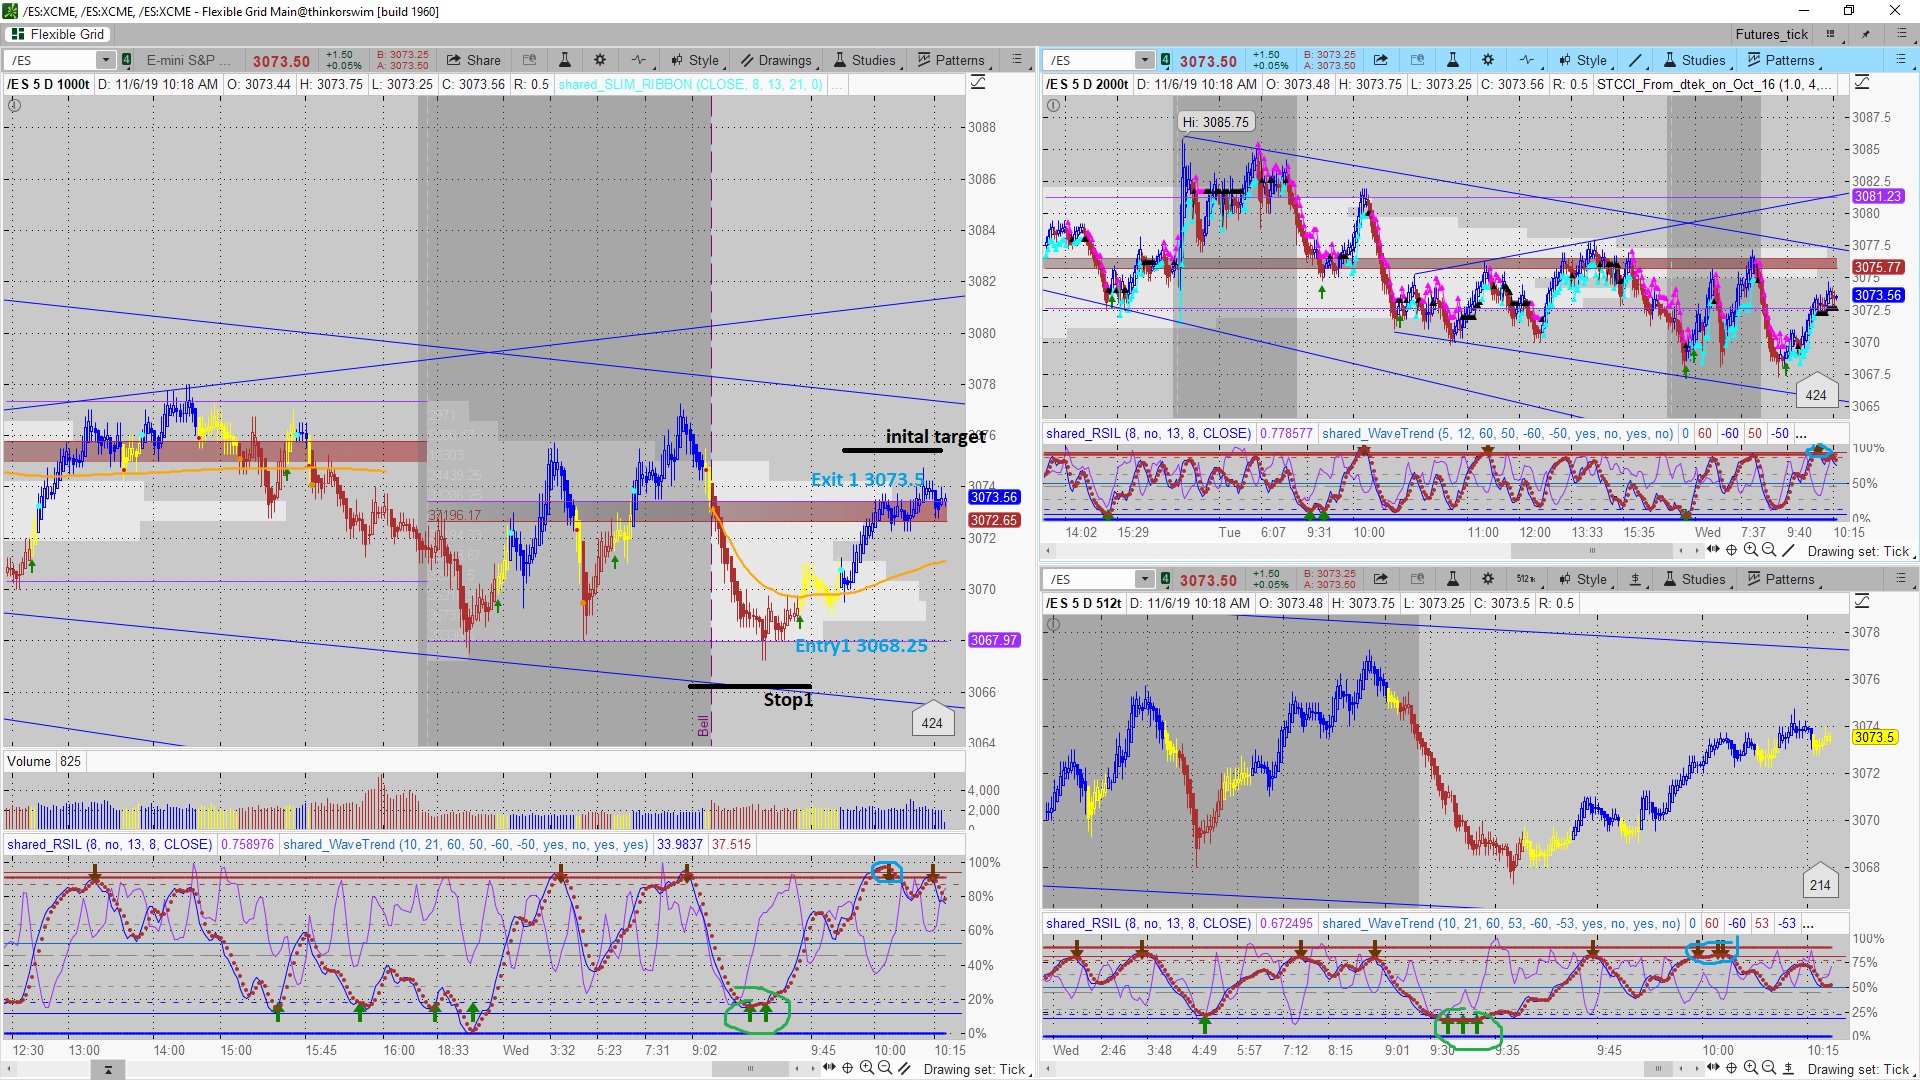
I'm sure at some point or another this has been done but thought I would try to give something back to this great community. I believe both these indicators are from users on this site but I could be mistaken. One the RSIL and the other some form of RSI I believe, cant remember the exact name. I really like the FE indicator on the RSIL but dont care too much for the rest of it. So I basically just did a fractal energy overlay on top of whatever study this is called. Its no holy grail because there is no such thing, but paired with multiple time frames and known support/resistance it has proved to be an absolutely lethal tool (for me anyways). Usually run a 512, 1000, and 1600 tick chart all with this same setup (minus the slim ribbon on the 1600). Any input is well appreciated.
Original version with indicators (grid chart) https://tos.mx/4gmXmj2
Attachments
Last edited by a moderator:

