/ES Futures Trading Strategy on ThinkorSwim

You can extend any drawing in TOS simply with a right click. I'm constantly adjusting trend lines to accommodate candle wicks. Most of the time trend lines in true triangle formations need zero adjustment. A good example is the screenshot you mentioned. However, I would not make trades based simply on one trend line.
 
You can extend any drawing in TOS simply with a right click. I'm constantly adjusting trend lines to accommodate candle wicks. Most of the time trend lines in true triangle formations need zero adjustment. A good example is the screenshot you mentioned. However, I would not make trades based simply on one trend line.
thank you also its general question my tos doesnt show synchronize disable option
 
You can extend any drawing in TOS simply with a right click. I'm constantly adjusting trend lines to accommodate candle wicks. Most of the time trend lines in true triangle formations need zero adjustment. A good example is the screenshot you mentioned. However, I would not make trades based simply on one trend line.
Question: how do you use Freedom of movement?
 
This is the definition of miserable

A0DKASW.png
 

Attachments

  • A0DKASW.png
    A0DKASW.png
    291.3 KB · Views: 101
Very frustrating market. Just like I told you guys - broadening formation. Very tricky to play and to discern early on
Last play was textbook but I missed the early entry and had to had tight stop

h6b4pVE.png


I guess I am happy enough got out break even. discipline and patience is key. A year earlier I would have lost a lot today!
 

Attachments

  • h6b4pVE.png
    h6b4pVE.png
    895.7 KB · Views: 88
Last edited:
This is the only play I moved on. I wanted to smash my head against my monitor pretty much all day.

CFFNQVU.png
 

Attachments

  • CFFNQVU.png
    CFFNQVU.png
    267.8 KB · Views: 97
Pretty much dude. I wasn't planning on riding that one out especially after all the BS price action that went on today. I had a theory that it might find some support around 14-15 and make another high but clearly I was wrong 😂
 
To Blake and Sky:
would you take long at 9:30 open? its not by the rule, but.....
thanks

zBKh3Gi.png
 

Attachments

  • zBKh3Gi.png
    zBKh3Gi.png
    503 bytes · Views: 72
@Talochka I didn't make that play because at exactly 9:30 it smoked the support @ 3112.50. Being that the biggest moves happen on the hour and half hour, I saw that as a sign that it was going to drop a considerable amount further. Looking back now, obviously it was just a head fake. Throw that on top of the fact that volume and price action had come to a screeching halt and the chop had already graced us with its presence, I saw the risk outweighing the reward.
 
I modified the Wave Trend Oscillator to assign price color when buy/sell signals are generated in order to clean up the lower a bit. Working on a similar way to incorporate FE into the upper as well.

Shareable link: WTO_PriceColor

Code:
#WT_LB Short Name TV
declare upper;
input Channel_Length = 10; #10
input Average_Length = 21; #10
input over_bought_1 = 60;
input over_bought_2 = 53;
input over_sold_1 = -60;
input over_sold_2 = -53;
input show_bubbles = yes;
input show_sec_bbls = no;
input show_alerts = yes;
def ap = hlc3;
def esa = ExpAverage(ap, Channel_Length);
def d = ExpAverage(AbsValue(ap - esa), Channel_Length);
def ci = (ap - esa) / (0.015 * d);
def tci = ExpAverage(ci, Average_Length);
def wt1 = tci;
def wt2 = SimpleMovingAvg(wt1, 4);

def signal1 = wt1 crosses above wt2 and wt1 < over_sold_2;

def signal2 = wt1 crosses below wt2 and wt1 > over_bought_2;

AssignPriceColor(if signal1 then Color.GREEN else if Signal2 then Color.RED else Color.GRAY);

8loRdOU.png
 

Attachments

  • 8loRdOU.png
    8loRdOU.png
    144.1 KB · Views: 93
Last edited by a moderator:
Big shout out to @horserider. Intraday Anchored VWAP now provides reading when FE falls below .5 (midline). As usual, color is all a matter of personal preference. This now leaves the 1000t chart completely free and clear of any lower studies. Pure bliss my dudes.

6slMiBm.png


Code:
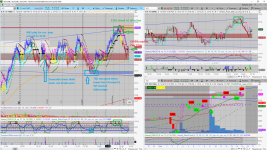
#yakBro intraday anchoredVWAP excluding extended hours volume 2019

declare upper;

def anchorTime = 0930;
def anchorEnd = 1600;

input ShowTodayOnly = yes;
def Today = if GetDay() == GetLastDay() then 1 else 0;
def postAnchorTime = if SecondsFromTime(anchorTime) >= 0 then 1 else 0;
def endAchorTime = if SecondsTillTime(anchorEnd) >= 0 then 1 else 0;

#plot anchorVWAP for intraday
def  volumeSum = CompoundValue(1, if postAnchorTime and endAchorTime then volumeSum[1] + volume else 0, volume);
def  volumeVwapSum = CompoundValue(1, if postAnchorTime and endAchorTime then volumeVwapSum[1] + volume * vwap else 0, volume * vwap);


#Inputs:
input nFE = 8;#hint nFE: length for Fractal Energy calculation.
input AlertOn = no;
input Glength  = 13;
input betaDev =  8;
input data = close;

def w = (2 * Double.Pi / Glength);
def beta = (1 - Cos(w)) / (Power(1.414, 2.0 / betaDev) - 1 );
def alpha = (-beta + Sqrt(beta * beta + 2 * beta));
def Go = Power(alpha, 4) * open +
             4 * (1 – alpha) * Go[1] – 6 * Power( 1 - alpha, 2 ) * Go[2] +
             4 * Power( 1 - alpha, 3 ) * Go[3] - Power( 1 - alpha, 4 ) * Go[4];
def Gh = Power(alpha, 4) * high +
             4 * (1 – alpha) * Gh[1] – 6 * Power( 1 - alpha, 2 ) * Gh[2] +
             4 * Power( 1 - alpha, 3 ) * Gh[3] - Power( 1 - alpha, 4 ) * Gh[4];
def Gl = Power(alpha, 4) * low +
             4 * (1 – alpha) * Gl[1] – 6 * Power( 1 - alpha, 2 ) * Gl[2] +
             4 * Power( 1 - alpha, 3 ) * Gl[3] - Power( 1 - alpha, 4 ) * Gl[4];
def Gc = Power(alpha, 4) * data +
             4 * (1 – alpha) * Gc[1] – 6 * Power( 1 - alpha, 2 ) * Gc[2] +
             4 * Power( 1 - alpha, 3 ) * Gc[3] - Power( 1 - alpha, 4 ) * Gc[4];
# Variables:
def o;
def h;
def l;
def c;
def CU1;
def CU2;
def CU;
def CD1;
def CD2;
def CD;
def L0;
def L1;
def L2;
def L3;


# Calculations
o = (Go + Gc[1]) / 2;
h = Max(Gh, Gc[1]);
l = Min(Gl, Gc[1]);
c = (o + h + l + Gc) / 4;
def gamma = Log(Sum((Max(Gh, Gc[1]) - Min(Gl, Gc[1])), nFE) /
        (Highest(Gh, nFE) - Lowest(Gl, nFE)))
            / Log(nFE);

L0 = (1 – gamma) * Gc + gamma * L0[1];
L1 = -gamma * L0 + L0[1] + gamma * L1[1];
L2 = -gamma * L1 + L1[1] + gamma * L2[1];
L3 = -gamma * L2 + L2[1] + gamma * L3[1];
if L0 >= L1
then {
    CU1 = L0 - L1;
    CD1 = 0;
} else {
    CD1 = L1 - L0;
    CU1 = 0;
}
if L1 >= L2
then {
    CU2 = CU1 + L1 - L2;
    CD2 = CD1;
} else {
    CD2 = CD1 + L2 - L1;
    CU2 = CU1;
}
if L2 >= L3
then {
    CU = CU2 + L2 - L3;
    CD = CD2;
} else {
    CU = CU2;
    CD = CD2 + L3 - L2;
}

plot anchorVWAP = if ShowTodayOnly and !Today then Double.NaN else if anchorTime then volumeVwapSum / volumeSum else Double.NaN;
anchorVWAP.SetStyle(Curve.FIRM);
anchorVWAP.SetLineWeight(2);


anchorVWAP.DefineColor("Up", GetColor(1));
anchorVWAP.DefineColor("Down", GetColor(0));
anchorVWAP.AssignValueColor(if gamma < .5 then anchorVWAP.Color("Down") else anchorVWAP.Color("Up"));
 

Attachments

  • 6slMiBm.png
    6slMiBm.png
    189 KB · Views: 93
@blakecmathis This awesome, does anyone know how I can change the final If Then Else statement so that the candles will color the normal slim ribbon colors whenever the Buy or Sell colored candles aren't painted? Or, just normal colors if that is too complicated? I realize I might have to change the buy and sell signal colors but I can handle that much at least.
 
@dolomick I've said this before man but in the past the slim ribbon coloring of the candles has been for psychological support. I've made good trades on green, yellow, and red candles and bad trades on green, yellow, and red. Makes no difference. If your strategy was setup to trade the coloring of the candles on the 1000t chart you would get absolutely roasted. Over the past couple weeks I have realized that it really isn't doing anything for me anymore. I've never sat here contemplating a play and thought "Well there's a yellow candle can't enter here" or "There's a green candle can't short that one". However, It can help you maintain a position. That is the reason why I decided to omit it from my strategy and paint candles based on the WTO. Trading the new setup tomorrow and will report back here.
 
@dolomick I've said this before man but in the past the slim ribbon coloring of the candles has been for psychological support. I've made good trades on green, yellow, and red candles and bad trades on green, yellow, and red. Makes no difference. If your strategy was setup to trade the coloring of the candles on the 1000t chart you would get absolutely roasted. Over the past couple weeks I have realized that it really isn't doing anything for me anymore. I've never sat here contemplating a play and thought "Well there's a yellow candle can't enter here" or "There's a green candle can't short that one". However, It can help you maintain a position. That is the reason why I decided to omit it from my strategy and paint candles based on the WTO. Trading the new setup tomorrow and will report back here.

Totally agree... but for now I would like the option of the psychological support. What I have been doing is putting the lower study with the WTO in my upper study and turning off everything but the arrows. The arrows appear at the very top and bottom of the chart though, and get a little wonky when zooming in. Serves the same purpose as the colored candles, and if I can get it cleaned up, it may be a nice alternative for those that prefer normal colored candles.
 
Yep tried that one brotha. Just didn't like how goofy everything looked with the signals being so far out. But I get what you're saying man if you could incorporate both that would be bad ***.
 

New Indicator: Buy the Dip

Check out our Buy the Dip indicator and see how it can help you find profitable swing trading ideas. Scanner, watchlist columns, and add-ons are included.

Download the indicator

Join useThinkScript to post your question to a community of 21,000+ developers and traders.

Not the exact question you're looking for?

Start a new thread and receive assistance from our community.

87k+ Posts
390 Online
Create Post

The Market Trading Game Changer

Join 2,500+ subscribers inside the useThinkScript VIP Membership Club
  • Exclusive indicators
  • Proven strategies & setups
  • Private Discord community
  • ‘Buy The Dip’ signal alerts
  • Exclusive members-only content
  • Add-ons and resources
  • 1 full year of unlimited support

Frequently Asked Questions

What is useThinkScript?

useThinkScript is the #1 community of stock market investors using indicators and other tools to power their trading strategies. Traders of all skill levels use our forums to learn about scripting and indicators, help each other, and discover new ways to gain an edge in the markets.

How do I get started?

We get it. Our forum can be intimidating, if not overwhelming. With thousands of topics, tens of thousands of posts, our community has created an incredibly deep knowledge base for stock traders. No one can ever exhaust every resource provided on our site.

If you are new, or just looking for guidance, here are some helpful links to get you started.

What are the benefits of VIP Membership?
VIP members get exclusive access to these proven and tested premium indicators: Buy the Dip, Advanced Market Moves 2.0, Take Profit, and Volatility Trading Range. In addition, VIP members get access to over 50 VIP-only custom indicators, add-ons, and strategies, private VIP-only forums, private Discord channel to discuss trades and strategies in real-time, customer support, trade alerts, and much more. Learn all about VIP membership here.
How can I access the premium indicators?
To access the premium indicators, which are plug and play ready, sign up for VIP membership here.
Back
Top