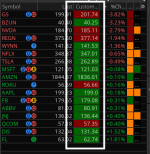
I wanted to quickly know if the stock price is currently above or below VWAP (Volume Weighted Average Price). One of our developers were able to help me put together a watchlist column that shows just that. Here is what it looks like.
Shared WatchList Link: http://tos.mx/X7jLAge Click here for --> Easiest way to load shared links

Notes:
Credit:
Shared WatchList Link: http://tos.mx/X7jLAge Click here for --> Easiest way to load shared links
Notes:
- Green means price is currently above VWAP
- Red means price is currently below VWAP
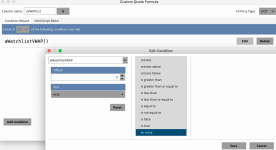
thinkScript Code
Rich (BB code):
plot vwap = vwap();
AssignBackgroundColor(if close > vwap then Color.DARK_GREEN else if close < vwap then Color.DARK_RED else Color.Dark_ORANGE);
Credit:
- WalkingBallista
Attachments
Last edited by a moderator:


