
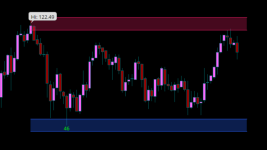
It's the smart money range indicator.
https://usethinkscript.com/threads/smart-money-range-chartprime-for-thinkorswim.16923/
Wondering if removing any/all of the coding that doesn't pertain to plotting the range itself is at all possible.
https://usethinkscript.com/threads/smart-money-range-chartprime-for-thinkorswim.16923/
Wondering if removing any/all of the coding that doesn't pertain to plotting the range itself is at all possible.
Code:
# https://www.tradingview.com/v/84zEwHEm/
#// This source code is subject to the terms of the Mozilla Public License 2.0
#// © ChartPrime
#indicator("Smart Money Range [ChartPrime]",shorttitle = "SMR [ChartPrime]"
# Converted by Sam4Cok@Samer800    - 10/2023 - Not typical resutls

input ShowLabel = yes;
input extendLines = no;
input showFiboLevels = no;
input zigzagLine = no;    # "Show Zigzag ?????"
input pivotLength = 60;    # "period"
input countCalculationMethod = {default "Price Cross", "Price Range"};
input thresholdPercentage = 10;
input atrLength = 30;
input atrMulti = 0.3;

def na = Double.NaN;
def last = IsNaN(close);
def hi = high;
def lo = low;
def per = thresholdPercentage / 100;
def perc = close * per;
def srdatr = ATR(Length = atrLength) * atrMulti;
def band_ = Min(srdatr, perc);
def band = band_[20];
def bar = AbsValue(BarNumber());

#-- Color
DefineGlobalColor("up", CreateColor(41, 98, 255));
DefineGlobalColor("Dn", CreateColor(233, 30, 99));
DefineGlobalColor("dup", CreateColor(0, 27, 100));
DefineGlobalColor("dDn", CreateColor(97, 9, 39));
DefineGlobalColor("786", CreateColor(244,67,54));
DefineGlobalColor("618", CreateColor(129,199,132));
DefineGlobalColor("500", CreateColor(76,175,80));
DefineGlobalColor("382", CreateColor(0,150,136));
DefineGlobalColor("236", CreateColor(100,181,246));
DefineGlobalColor("000", CreateColor(95,95,95));
#Counter(lev,sup = true)=>
script Counter {
    input level = close;
    input sup = yes;
    input method = "Price Cross";
    input band = 0;
    def last = isNaN(open);
    def cond = method == "Price Cross";
    def lev = level;
    def bandHi = lev + band;
    def bandLo = lev - band;
    def bar = AbsValue(BarNumber());
    def lastBar = if last then 0 else bar;
    def startBar = bar > HighestAll(lastBar) - 2000;
    def cntDn = if !startBar then 0 else
                if (low[1] < lev) and (close > lev) then cntDn[1] + 1 else cntDn[1];
    def cntUp = if !startBar then 0 else
                if (high[1] > lev) and (close < lev)  then cntUp[1] + 1 else cntUp[1];
    def BandDn = if !startBar then 0 else
                if (low[1] < bandLo) and (close > bandLo) then BandDn[1] + 1 else BandDn[1];
    def BandUp = if !startBar then 0 else
                if (high[1] > bandHi) and (close < bandHi) then BandUp[1] + 1 else BandUp[1];
    def Count = if cond then
                if sup then cntDn else cntUp else
                if sup then BandDn else BandUp;
    def Counter = highestAll(Count);
    plot out = Counter;
}
script FindPivots {
    input dat = close; # default data or study being evaluated
    input HL  = 0;    # default high or low pivot designation, -1 low, +1 high
    input lbL  = 5;    # default Pivot Lookback Left
    input lbR  = 1;    # default Pivot Lookback Right
    ##############
    def _nan;    # used for non-number returns
    def _BN;     # the current barnumber
    def _VStop;  # confirms that the lookforward period continues the pivot trend
    def _V;      # the Value at the actual pivot point
    def _pivotRange;
    ##############
    _BN  = BarNumber();
    _nan = Double.NaN;
    _pivotRange = lbL + lbL;
    _VStop = if !IsNaN(dat[_pivotRange]) and lbR > 0 and lbL > 0 then
                fold a = 1 to lbR + 1 with b=1 while b do
                    if HL > 0 then dat > GetValue(dat, -a) else dat < GetValue(dat, -a) else _nan;
    if (HL > 0) {
        _V = if _BN > lbL and dat == Highest(dat, lbL + 1) and _VStop
            then dat else _nan;
    } else {
        _V = if _BN > lbL and dat == Lowest(dat, lbL + 1) and _VStop
            then dat else _nan;
    }
    plot result = if !IsNaN(_V) and _VStop then _V else _nan;
}
#/ ~~ Pivots {
def startBar = bar > 2000;#bar > HighestAll(bar) - 2100;
def pvtHi_ = findpivots(hi, 1, pivotLength, pivotLength);
def pvtLo_ = findpivots(lo,-1, pivotLength, pivotLength);
def pvtHi = !IsNaN(pvtHi_);
def pvtLo = !IsNaN(pvtLo_);
def ph_   = if pvtHi then hi else ph_[1];
def pl_   = if pvtLo then lo  else pl_[1];
def indH_ = if pvtHi then bar else indH_[1];
def indL_ = if pvtLo then bar else indL_[1];
def phRes  = ph_;
def plSup  = pl_;
def indexH = (indH_);
def indexL = (indL_);
#-- Calc Band
def perPl = plSup * per;
def bandpl_ = Min(srdatr, perPl);
def bandSup = bandpl_[20];
def perPh = phRes * per;
def bandph_ = Min(srdatr, perPh);
def bandRes = bandph_[20];
#-- Cal counter
def SupVal = highestAll(InertiaAll(plSup,2));
def ResVal = highestAll(InertiaAll(phRes,2));
def ValRes = Counter(ResVal,  no, countCalculationMethod, bandRes);
def ValSup = Counter(SupVal, yes, countCalculationMethod, bandSup);
def ResValue = ValRes;
def SupValue = ValSup;
#-- Cal Sup/Res
def barDif = AbsValue(bar - indexH);
def cntRes = min(barDif, 1000);
def cnt = cntRes + 1;
def Sup_Value = fold i = 1 to cnt with p = lo do
                Min(p, GetValue(lo, i));
def Res_Value = fold j = 1 to cnt with q = hi do
                Max(q, GetValue(hi, j));

def SuppValue = Sup_Value;
def RessValue = Res_Value;

def SuppVal = HighestAll(InertiaAll(SuppValue, 2));
def RessVal = HighestAll(InertiaAll(RessValue, 2));

def SupValuePvt  = HighestAll(InertiaAll(SuppValue + band, 2));
def SupValuePvt1 = HighestAll(InertiaAll(SuppValue - band , 2));
def ResValuePVT  = HighestAll(InertiaAll(RessValue - band, 2));
def ResValuePVT1 = HighestAll(InertiaAll(RessValue + band , 2));

def SupportValue = SuppVal;
def ResistValue  = RessVal;

def SupValueLine = (SupValuePvt);
def SupValueLine1 = (SupValuePvt1);

def ResValueLine = (ResValuePVT);
def ResValueLine1 = (ResValuePVT1);

def Sup_Bar = if SuppValue!=SuppValue[1] then bar else Sup_Bar[1];
def Res_Bar = if RessValue!=RessValue[1] then bar else Res_Bar[1];
def SupBar = HighestAll(Sup_Bar);
def ResBar = HighestAll(Res_Bar);
def barLine = Min(ResBar, SupBar);
def startPlot = (barLine);

def startCond = if last[3] then na else
                if extendLines then yes else bar > startPlot-1;

def midUp = if !startCond then na else (ResistValue);
def midLo = if !startCond then na else (SupportValue);
def midVal = (midUp + midLo) / 2;

def upper = if !startCond then na else ResValueLine;
def lower = if !startCond then na else SupValueLine;
def upperATR = if !startCond then na else ResValueLine1;
def lowerATR = if !startCond then na else SupValueLine1;

def SupBarPvt = bar == HighestAll(SupBar);
def ResBarPvt = bar == HighestAll(ResBar);

#-- Plots

plot valueRes = if ResBarPvt then ResValue else na;
valueRes.SetLineWeight(3);
valueRes.SetPaintingStrategy(PaintingStrategy.VALUES_ABOVE);
valueRes.SetDefaultColor(Color.RED);

plot valueSup = if SupBarPvt then SupValue else na;
valueSup.SetLineWeight(3);
valueSup.SetPaintingStrategy(PaintingStrategy.VALUES_BELOW);
valueSup.SetDefaultColor(Color.GREEN);

#-- ZigZag
Script DrawLine {
input fromBar = no;
input toBar = no;
input stVal = close;
input enVal = close;
input fromBarAdd = 0;
input tobarAdd = 0;
    def bar = AbsValue(BarNumber());
    def fromBn = if fromBar then Bar else fromBn[1];
    def toBn = if toBar then Bar else toBn[1];
    def hFromBar = highestAll(fromBn + fromBarAdd);
    def hToBar = highestAll(toBn + tobarAdd);
    def bull = hFromBar > hToBar;
    def fromValH = highestall(stVal);
    def toValH   = highestall(enVal);
    def fromBar1 = hFromBar;#highestAll(ResBar);
    def toBar1   = hToBar;#highestAll(SupBar + 50);
    def slope1  = if bull then (fromValH - enVal) / (fromBar1 - toBar1) else
                               (toValH   - stVal) / (toBar1 - fromBar1);
    def line1 = if bull then enVal + ((bar - toBar1) * slope1) else
                             stVal + ((bar - fromBar1) * slope1);
    plot out = line1;
}

def bull = ResBar > SupBar;
def fromVal = RessVal;
def toVal   = SuppVal + band/2;
def fromValH = highestall(fromVal);
def toValH   = highestall(toVal);

def fromBar1 = highestAll(ResBar);
def toBar1   = highestAll(SupBar + 50);
def fromBar11 = highestAll(ResBar + 2);
def toBar11   = highestAll(SupBar + 52);

def toCond = SuppValue!=SuppValue[1];
def frmCond = RessValue!=RessValue[1];
def line1 = DrawLine(frmCond, toCond, RessVal, SuppVal, 0, 50);
def line11 = DrawLine(frmCond, toCond, RessVal, SuppVal, 2, 52);

def slope1  = if bull then (fromValH - toVal)   / (fromBar1  - toBar1) else
                           (toValH   - fromVal) / (toBar1    - fromBar1);
def slope11 = if bull then (fromValH - toVal)   / (fromBar11 - toBar11) else
                           (toValH   - fromVal) / (toBar11   - fromBar11);

def fromVal2 = SuppVal;
def toVal2   = line1 + band/2;
def fromValH2 = highestall(fromVal2);
def toValH2   = highestall(toVal2 );
def fromBar2  = highestAll(SupBar + 50);
def toBar2    = highestAll(ResBar);

def line2 = DrawLine(toCond, line1==SuppVal, RessValue, SuppVal, 0, 0);
def line22 = DrawLine(toCond, line1==SuppVal, RessVal, SuppVal, 2, 2);

def plotCond = bar > startPlot-1;
def zigPlotCond1  = zigzagLine and line1 >= SupportValue and line1 <= ResistValue and plotCond;
def zigPlotCond11 = zigzagLine and line11 >= SupportValue and line11 <= ResistValue and plotCond;
def zigPlotCond2  = zigzagLine and line2 >= SupportValue and line2 <= ResistValue and plotCond;
def zigPlotCond22  = zigzagLine and line22 >= SupportValue and line22 <= ResistValue and plotCond;

plot ZigZag1  = if zigPlotCond1  then line1 else na;
plot ZigZag11 = if zigPlotCond11 then line11 else na;
plot ZigZag2  = if zigPlotCond2  then line2 else na;
plot ZigZag22 = if zigPlotCond22 then line22 else na;
ZigZag1.SetDefaultColor(GetColor(4));
ZigZag1.SetStyle(Curve.MEDIUM_DASH);
ZigZag11.SetDefaultColor(GetColor(4));
ZigZag11.SetStyle(Curve.MEDIUM_DASH);
ZigZag2.SetDefaultColor(GetColor(4));
ZigZag2.SetStyle(Curve.MEDIUM_DASH);
ZigZag22.SetDefaultColor(GetColor(4));
ZigZag22.SetStyle(Curve.MEDIUM_DASH);


#-- Label

AddLabel(ShowLabel,"Sup Hit ("+ SupValue + ")", GetColor(2));
AddLabel(ShowLabel,"Res Hit ("+ ResValue + ")", GlobalColor("up"));

#-- Cloud
AddCloud(upper, upperATR, GlobalColor("dn"), GlobalColor("dn"), yes);
AddCloud(lowerATR, lower, GlobalColor("up"), GlobalColor("up"), yes);

#-- fibo Calc
#def bull = ResBar > supBar;
def condPlot = showFiboLevels and bar >= startPlot-1 and !last[2];
def SupResDif = (RessVal - SuppVal);
def lvl000 = if bull then SuppVal else RessValue;
def lvl236 = if bull then SuppVal + SupResDif * 0.236 else RessVal - SupResDif * 0.236;
def lvl382 = if bull then SuppVal + SupResDif * 0.382 else RessVal - SupResDif * 0.382;
def lvl500 = if bull then SuppVal + SupResDif * 0.500 else RessVal - SupResDif * 0.500;
def lvl618 = if bull then SuppVal + SupResDif * 0.618 else RessVal - SupResDif * 0.618;
def lvl786 = if bull then SuppVal + SupResDif * 0.786 else RessVal - SupResDif * 0.786;
def lvl100 = if bull then SuppVal + SupResDif * 1.000 else RessVal - SupResDif * 1.000;

plot lvl10 = if condPlot then lvl100 else na;
plot lvl78 = if condPlot then lvl786 else na;
plot lvl61 = if condPlot then lvl618 else na;
plot lvl50 = if condPlot then lvl500 else na;
plot lvl38 = if condPlot then lvl382 else na;
plot lvl23 = if condPlot then lvl236 else na;
plot lvl00 = if condPlot then lvl000 else na;

lvl10.SetPaintingStrategy(PaintingStrategy.DASHES);
lvl78.SetPaintingStrategy(PaintingStrategy.DASHES);
lvl61.SetPaintingStrategy(PaintingStrategy.DASHES);
lvl50.SetPaintingStrategy(PaintingStrategy.DASHES);
lvl38.SetPaintingStrategy(PaintingStrategy.DASHES);
lvl23.SetPaintingStrategy(PaintingStrategy.DASHES);
lvl00.SetPaintingStrategy(PaintingStrategy.DASHES);

lvl10.SetDefaultColor(GlobalColor("000"));
lvl78.SetDefaultColor(GlobalColor("786"));
lvl61.SetDefaultColor(GlobalColor("618"));
lvl50.SetDefaultColor(GlobalColor("500"));
lvl38.SetDefaultColor(GlobalColor("382"));
lvl23.SetDefaultColor(GlobalColor("236"));
lvl00.SetDefaultColor(GlobalColor("000"));

#-- Volume Profile
input pricePerRowHeightMode = {default AUTOMATIC, TICKSIZE, CUSTOM};
input customRowHeight = 1.0;
input onExpansion = yes;
input showVolumeProfile = yes;
input showPointOfControl = yes;
input showValueArea = yes;
input valueAreaPercent = 50;
input opacity = 30;

def cond = !plotCond;
def height;
switch (pricePerRowHeightMode) {
case AUTOMATIC:
    height = PricePerRow.AUTOMATIC;
case TICKSIZE:
    height = PricePerRow.TICKSIZE;
case CUSTOM:
    height = customRowHeight;
}

profile vol = volumeProfile("startNewProfile" = cond, "onExpansion" = onExpansion, "numberOfProfiles" = 1, "pricePerRow" = height, "value area percent" = valueAreaPercent);
def con = compoundValue(1, onExpansion, no);
def pc = if IsNaN(vol.getPointOfControl()) and con then pc[1] else vol.getPointOfControl();
def hVA = if IsNaN(vol.getHighestValueArea()) and con then hVA[1] else vol.getHighestValueArea();
def lVA = if IsNaN(vol.getLowestValueArea()) and con then lVA[1] else vol.getLowestValueArea();

def hProfile = if IsNaN(vol.getHighest()) and con then hProfile[1] else vol.getHighest();
def lProfile = if IsNaN(vol.getLowest()) and con then lProfile[1] else vol.getLowest();
def plotsDomain = !last and plotCond;

plot POC = if plotsDomain and showPointOfControl then pc else Double.NaN;
plot ProfileHigh = if plotsDomain and showVolumeProfile then hProfile else Double.NaN;
plot ProfileLow = if plotsDomain and showVolumeProfile then lProfile else Double.NaN;
plot VAHigh = if plotsDomain and showValueArea then hVA else Double.NaN;
plot VALow = if plotsDomain and showValueArea then lVA else Double.NaN;

DefineGlobalColor("Profile", GetColor(1));
DefineGlobalColor("Point Of Control", GetColor(5));
DefineGlobalColor("Value Area", Color.PLUM);#GetColor(8));

vol.show(if showVolumeProfile then globalColor("Profile") else color.current, if showVolumeProfile then globalColor("Point Of Control") else color.current, if showVolumeProfile then globalColor("Value Area") else color.current, opacity);
POC.SetDefaultColor(globalColor("Point Of Control"));
POC.SetStyle(Curve.POINTS);
VAHigh.SetPaintingStrategy(PaintingStrategy.SQUARES);
VALow.SetPaintingStrategy(PaintingStrategy.SQUARES);
VAHigh.SetDefaultColor(globalColor("Value Area"));
VALow.SetDefaultColor(globalColor("Value Area"));
ProfileHigh.SetPaintingStrategy(PaintingStrategy.DASHES);
ProfileLow.SetPaintingStrategy(PaintingStrategy.DASHES);
ProfileHigh.SetDefaultColor(GlobalColor("dn"));
ProfileLow.SetDefaultColor(GlobalColor("up"));


#-- END of Code
Attachments
Last edited by a moderator: