Drawing zig zag lines but based on highs lows (not percentage)

dl14

New member
Hello thinkscript community! I'm trying to draw zig zag lines (similar to the zigzaghighlow script that comes with TOS) but I want to do it based on the highs and lows compared to previous candles, not the % move. Specifically: (up case is described here) if a candle (let's call this c0) high is above the previous candle (let's call this c[1]) high, and the low (of c0) is above the low (of c[1]) --> I want to draw a line from the low of the previous candle to the high of the new candle, now if the next candle is also "higher" than the current candle, the trend would continue to be up so the line should extend to the high of the most recent candle.

The trend would change when the same thing mentioned above happens on the downside: the candle low is below the previous candle low and the high is below the previous high (and above the previous low). Then it would draw a line from the previous candle high, to the new candle low.

Attached is an example, the yellow lines wouldn't actually be drawn, they are just the mental calculation of finding the highest point, the white line is what I'd actually want to see! Is this possible?
 

Attachments

  • Screen Shot 2023-08-05 at 10.09.00 PM.png
    Screen Shot 2023-08-05 at 10.09.00 PM.png
    113.8 KB · Views: 125
Here, give this a try. This is something I created a long time ago and don't currently use. It didn't used to draw the zig-zag lines, but I modified it so it does now.

There are a few parameters you can change to pick up bigger/smaller moves. Generally I find leaving swing forward and swing back somewhere between 6-15 is a good place to start.

It also has a feature to draw horizontal lines on the swing points, either just the last swing or all swings. make sure you look at the configuration options / settings and experiment with them a bit.

1692457127690.png


1692457055355.png


Ruby:
# DECLARATIONS
declare upper;

# USER INPUTS
input show_points = yes;
input dot_size = 1;
input dot_distance = 2;
input show_horiz_lines = yes;
input show_zigzag_lines = yes;
input price_type = {default High_Low, Open_Close, Close_Only};
input swing_back = 6;
input swing_forward = 6;
input maxbars = 500;
input sound_alert_on_cross = no;
input show_labels = no;
input show_only_last_swing = yes;


# GLOBAL COLOR DEFINITIONS
DefineGlobalColor("Green", CreateColor(0, 155, 0));
DefineGlobalColor("Red", CreateColor(225, 105, 105));
DefineGlobalColor("Gray", CreateColor(192, 192, 192));


# CALCULATIONS
def sb = swing_back;
def sf = swing_forward;
def na = Double.NaN;

def PriceHigh =
    if price_type == price_type.High_Low then high
    else if price_type == price_type.Open_Close then Max(open, close)
    else if price_type == price_type.Close_Only then close
    else close
;
def PriceLow =
    if price_type == price_type.High_Low then low
    else if price_type == price_type.Open_Close then Min(open, close)
    else if price_type == price_type.Close_Only then close
    else close
;

def lfor = Lowest(PriceLow, sf)[-sf];
def lback = Lowest(PriceLow, sb)[1];
def hfor = Highest(PriceHigh, sf)[-sf];
def hback = Highest(PriceHigh, sb)[1];
def swinglow = if PriceLow < lfor and PriceLow <= lback then yes else no;
def swinghigh = if PriceHigh > hfor and PriceHigh >= hback then yes else no;

def lsl = if IsNaN(close[-sf]) then lsl[1] else if swinglow then PriceLow else lsl[1];
def lsh = if swinghigh then PriceHigh else lsh[1];
def lcount = if swinglow then 1 else lcount[1] + 1;
def hcount = if swinghigh then 1 else hcount[1] + 1;

def slcount = if swinglow then slcount[1] + 1 else slcount[1];
def shcount = if swinghigh then shcount[1] + 1 else shcount[1];
def onlylastslplotbar = slcount == HighestAll(slcount);
def onlylastshplotbar = shcount == HighestAll(shcount);


def lastlowdata =
    if lcount <= maxbars and IsNaN(close[-sf]) then lsl[1]
    else if lcount > maxbars then na
    else if lcount < 2 then na
    else lsl;
def lasthighdata =
    if hcount <= maxbars and IsNaN(close[-sf]) then lsh[1]
    else if hcount > maxbars then na
    else if hcount < 2 then na
    else lsh;

def slData = if swinglow then PriceLow - (dot_distance * TickSize()) else na;
def shData = if swinghigh then PriceHigh + (dot_distance * TickSize()) else na;
def allPointsData = if swinglow then slData else if swinghigh then shData else na;

def lineColorData = if swinglow then 1 else if swinghigh then -1 else lineColorData[1];

# PLOTS
plot sl = slData;
plot sh = shData;
plot lastlow =
    if show_only_last_swing then
        if onlylastslplotbar then
            lastlowdata
        else na
    else
        lastlowdata;
plot lasthigh =
    if show_only_last_swing then
        if onlylastshplotbar then
            lasthighdata
        else na
    else
        lasthighdata;

plot allPoints = allPointsData;

# ALERTS
Alert(high >= lasthigh AND sound_alert_on_cross, "New High", Alert.BAR, Sound.Ding);
Alert(low <= lastlow AND sound_alert_on_cross, "New Low", Alert.BAR, Sound.Ding);


# FORMATTING
sh.SetStyle(curve.points);
sh.SetLineWeight(dot_size);
sh.assignvaluecolor(if SH > lasthigh[1] then GlobalColor("Green") else GlobalColor("Red"));
sh.SetHiding(show_points == No);
sh.HideBubble();
sh.HideTitle();
sl.SetStyle(curve.points);
sl.SetLineWeight(dot_size);
sl.assignvaluecolor(if SL < lastlow[1] then GlobalColor("Red") else GlobalColor("Green"));
sl.SetHiding(show_points == No);
sl.HideBubble();
sl.HideTitle();

lasthigh.SetStyle(curve.SHORT_DASH);
lasthigh.AssignValueColor(GlobalColor("Gray"));
lasthigh.SetHiding(show_horiz_lines == No);
lasthigh.HideBubble();
lasthigh.HideTitle();

lastlow.SetStyle(curve.sHORT_DASH);
lastlow.AssignValueColor(GlobalColor("Gray"));
lastlow.SetHiding(show_horiz_lines == No);
lastlow.HideBubble();
lastlow.HideTitle();

allPoints.AssignValueColor(if lineColorData == -1 then GlobalColor("Red") else if lineColorData == 1 then GlobalColor("Green") else GlobalColor("Gray"));
allPoints.SetHiding(show_zigzag_lines == No);
allPoints.EnableApproximation();
allPoints.HideBubble();
allPoints.HideTitle();
 
Hello thinkscript community! I'm trying to draw zig zag lines (similar to the zigzaghighlow script that comes with TOS) but I want to do it based on the highs and lows compared to previous candles, not the % move. Specifically: (up case is described here) if a candle (let's call this c0) high is above the previous candle (let's call this c[1]) high, and the low (of c0) is above the low (of c[1]) --> I want to draw a line from the low of the previous candle to the high of the new candle, now if the next candle is also "higher" than the current candle, the trend would continue to be up so the line should extend to the high of the most recent candle.

The trend would change when the same thing mentioned above happens on the downside: the candle low is below the previous candle low and the high is below the previous high (and above the previous low). Then it would draw a line from the previous candle high, to the new candle low.

Attached is an example, the yellow lines wouldn't actually be drawn, they are just the mental calculation of finding the highest point, the white line is what I'd actually want to see! Is this possible?

this will find a sequence of up bars or down bars,
and plot lines (up to 10) from the first bar, to each bar in the group.

since all the lines in a group start on the same bar, a study needs to have a plot code line for each line and supporting formulas for each plot. if you want to see 10 lines, a study needs 10 plots. (what i did).
this will find how many sequencial, similar bars, but only plots up to 10 lines. the quantity of bars is limited by n = 100.

this study,
..on the first bar of a group, looks ahead to count how many similar bars are in the group
..calculate a slope for each line
..calculate data for each line
..plot the lines
..a bubble shows how many bars are in the group. (this number may be > 10)

can pick a minimum quantity of lines to be in a group.
default is 2, so there won't be a bunch of 1 line groups drawn.


cons,
sometimes a line is drawn from the last bar to the first bar in the next group.


Code:
#zigzag_multi_trend_lines_0

#https://usethinkscript.com/threads/drawing-zig-zag-lines-but-based-on-highs-lows-not-percentage.16290/
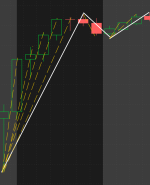
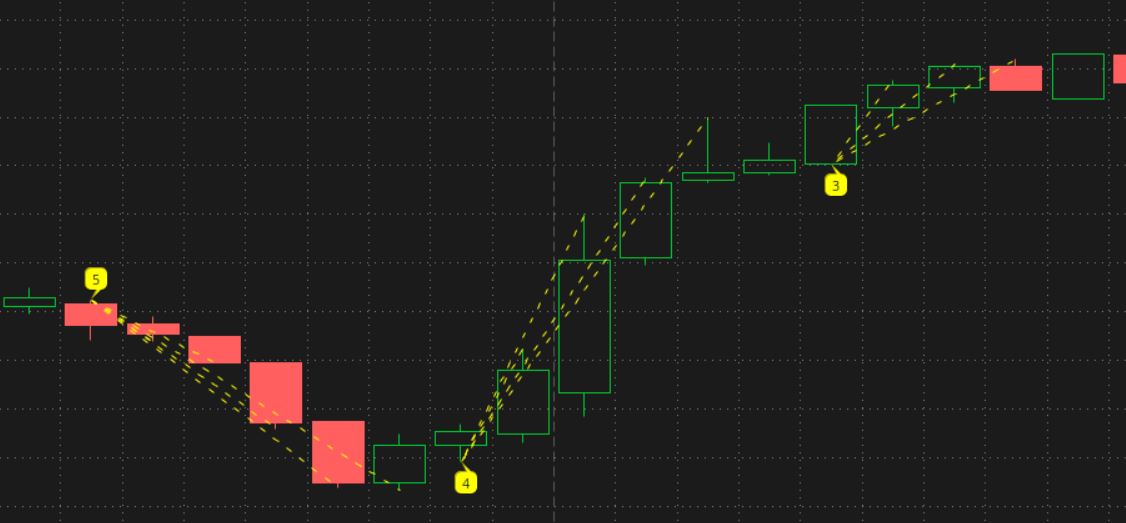
#multiple diag lines from a low, or a high

up case,
if high > previous high and the low > previous low
draw a line from the low of the previous candle to the high of the new candle


def na = double.nan;
def bn = barnumber();

input n = 100;
def up = high[0] > high[1] and low[0] > low[1];
def dwn = high[0] < high[1] and low[0] < low[1];

def firstup = up and !up[1];
def firstdwn = dwn and !dwn[1];

# find qty of up/down bars in a row
def upqty;
def dwnqty;
def revcnt;
def cnt;
if bn == 1 then {
 upqty = 0;
 dwnqty = 0;
 revcnt = 0;
 cnt = -1;
} else if !up and !dwn then {
#if not up or dwn then nothing
 upqty = 0;
 dwnqty = 0;
 revcnt = 0;
 cnt = -1;
} else if firstup then {
# on 1st up, loop to find qty of higher bars
 upqty = fold k1 = 1 to n
  with p1
  while getvalue(up, -k1)
  do p1 + 1;
 dwnqty = 0;
 revcnt = upqty;
 cnt = 0;
} else if firstdwn then {
# on 1st dwn, loop to find qty of lower bars
 upqty = 0;
 dwnqty = fold k2 = 1 to n
  with p2
  while getvalue(dwn, -k2)
  do p2 + 1;
 revcnt = dwnqty;
 cnt = 0;
} else {
 upqty = upqty[1];
 dwnqty = dwnqty[1];
 revcnt = revcnt[1] - 1;
 cnt = cnt[1] + 1;
}


#calc slopes
input min_qty = 2;
def s1;
def s2;
def s3;
def s4;
def s5;
def s6;
def s7;
def s8;
def s9;
def s10;
if bn == 1 then {
 s1 = 0;
 s2 = 0;
 s3 = 0;
 s4 = 0;
 s5 = 0;
 s6 = 0;
 s7 = 0;
 s8 = 0;
 s9 = 0;
 s10 = 0;
} else if firstup then {
 s1 = if upqty >= min_qty and upqty >= 1 then (getvalue(high, -1) - low) / 1 else 0;
 s2 = if upqty >= min_qty and upqty >= 2 then (GetValue(high, -2) - low) / 2 else 0;
 s3 = if upqty >= min_qty and upqty >= 3 then (GetValue(high, -3) - low) / 3 else 0;
 s4 = if upqty >= min_qty and upqty >= 4 then (GetValue(high, -4) - low) / 4 else 0;
 s5 = if upqty >= min_qty and upqty >= 5 then (GetValue(high, -5) - low) / 5 else 0;
 s6 = if upqty >= min_qty and upqty >= 6 then (GetValue(high, -6) - low) / 6 else 0;
 s7 = if upqty >= min_qty and upqty >= 7 then (GetValue(high, -7) - low) / 7 else 0;
 s8 = if upqty >= min_qty and upqty >= 8 then (GetValue(high, -8) - low) / 8 else 0;
 s9 = if upqty >= min_qty and upqty >= 9 then (GetValue(high, -9) - low) / 9 else 0;
 s10 = if upqty >= min_qty and upqty >= 10 then (GetValue(high, -10) - low) / 10 else 0;
} else if firstdwn then {
 s1 = if dwnqty >= min_qty and dwnqty >= 1 then (getvalue(low, -1) - high) / 1 else 0;
 s2 = if dwnqty >= min_qty and dwnqty >= 2 then (getvalue(low, -2) - high) / 2 else 0;
 s3 = if dwnqty >= min_qty and dwnqty >= 3 then (getvalue(low, -3) - high) / 3 else 0;
 s4 = if dwnqty >= min_qty and dwnqty >= 4 then (getvalue(low, -4) - high) / 4 else 0;
 s5 = if dwnqty >= min_qty and dwnqty >= 5 then (getvalue(low, -5) - high) / 5 else 0;
 s6 = if dwnqty >= min_qty and dwnqty >= 6 then (getvalue(low, -6) - high) / 6 else 0;
 s7 = if dwnqty >= min_qty and dwnqty >= 7 then (getvalue(low, -7) - high) / 7 else 0;
 s8 = if dwnqty >= min_qty and dwnqty >= 8 then (getvalue(low, -8) - high) / 8 else 0;
 s9 = if dwnqty >= min_qty and dwnqty >= 9 then (getvalue(low, -9) - high) / 9 else 0;
 s10 = if dwnqty >= min_qty and dwnqty >= 10 then (getvalue(low, -10) - high) / 10 else 0;
} else {
 s1 = s1[1];
 s2 = s2[1];
 s3 = s3[1];
 s4 = s4[1];
 s5 = s5[1];
 s6 = s6[1];
 s7 = s7[1];
 s8 = s8[1];
 s9 = s9[1];
 s10 = s10[1];
}

# calc line data
def line1 = if upqty == 0 and dwnqty == 0 then na
 else if max(upqty, dwnqty) < 1 then na
 else if cnt < 0 or cnt > 1 then na
 else if firstup then low
 else if firstdwn then high
 else line1[1] + s1;

def line2 = if upqty == 0 and dwnqty == 0 then na
 else if max(upqty, dwnqty) < 2 then na
 else if cnt < 0 or cnt > 2 then na
 else if firstup then low
 else if firstdwn then high
 else line2[1] + s2;

def line3 = if upqty == 0 and dwnqty == 0 then na
 else if max(upqty, dwnqty) < 3 then na
 else if cnt < 0 or cnt > 3 then na
 else if firstup then low
 else if firstdwn then high
 else line3[1] + s3;

def line4 = if upqty == 0 and dwnqty == 0 then na
 else if max(upqty, dwnqty) < 4 then na
 else if cnt < 0 or cnt > 4 then na
 else if firstup then low
 else if firstdwn then high
 else line4[1] + s4;

def line5 = if upqty == 0 and dwnqty == 0 then na
 else if max(upqty, dwnqty) < 5 then na
 else if cnt < 0 or cnt > 5 then na
 else if firstup then low
 else if firstdwn then high
 else line5[1] + s5;

def line6 = if upqty == 0 and dwnqty == 0 then na
 else if max(upqty, dwnqty) < 6 then na
 else if cnt < 0 or cnt > 6 then na
 else if firstup then low
 else if firstdwn then high
 else line6[1] + s6;

def line7 = if upqty == 0 and dwnqty == 0 then na
 else if max(upqty, dwnqty) < 7 then na
 else if cnt < 0 or cnt > 7 then na
 else if firstup then low
 else if firstdwn then high
 else line7[1] + s7;

def line8 = if upqty == 0 and dwnqty == 0 then na
 else if max(upqty, dwnqty) < 8 then na
 else if cnt < 0 or cnt > 8 then na
 else if firstup then low
 else if firstdwn then high
 else line8[1] + s8;

def line9 = if upqty == 0 and dwnqty == 0 then na
 else if max(upqty, dwnqty) < 9 then na
 else if cnt < 0 or cnt > 9 then na
 else if firstup then low
 else if firstdwn then high
 else line9[1] + s9;

def line10 = if upqty == 0 and dwnqty == 0 then na
 else if max(upqty, dwnqty) < 10 then na
 else if cnt < 0 or cnt > 10 then na
 else if firstup then low
 else if firstdwn then high
 else line10[1] + s10;

#draw diag lines
plot z1 = if max(upqty,dwnqty) >= min_qty then line1 else na;
plot z2 = if max(upqty,dwnqty) >= min_qty then line2 else na;
plot z3 = if max(upqty,dwnqty) >= min_qty then line3 else na;
plot z4 = if max(upqty,dwnqty) >= min_qty then line4 else na;
plot z5 = if max(upqty,dwnqty) >= min_qty then line5 else na;
plot z6 = if max(upqty,dwnqty) >= min_qty then line6 else na;
plot z7 = if max(upqty,dwnqty) >= min_qty then line7 else na;
plot z8 = if max(upqty,dwnqty) >= min_qty then line8 else na;
plot z9 = if max(upqty,dwnqty) >= min_qty then line9 else na;
plot z10 = if max(upqty,dwnqty) >= min_qty then line10 else na;
z1.SetStyle(Curve.SHORT_DASH);
z2.SetStyle(Curve.SHORT_DASH);
z3.SetStyle(Curve.SHORT_DASH);
z4.SetStyle(Curve.SHORT_DASH);
z5.SetStyle(Curve.SHORT_DASH);
z6.SetStyle(Curve.SHORT_DASH);
z7.SetStyle(Curve.SHORT_DASH);
z8.SetStyle(Curve.SHORT_DASH);
z9.SetStyle(Curve.SHORT_DASH);
z10.SetStyle(Curve.SHORT_DASH);
z1.SetDefaultColor(Color.yellow);
z2.SetDefaultColor(Color.yellow);
z3.SetDefaultColor(Color.yellow);
z4.SetDefaultColor(Color.yellow);
z5.SetDefaultColor(Color.yellow);
z6.SetDefaultColor(Color.yellow);
z7.SetDefaultColor(Color.yellow);
z8.SetDefaultColor(Color.yellow);
z9.SetDefaultColor(Color.yellow);
z10.SetDefaultColor(Color.yellow);


#------------------
# test stuff

input show_bar_quantities = yes;
addchartbubble(show_bar_quantities and firstup and upqty >= min_qty, low,
upqty + "\n" 
, color.yellow, no);

addchartbubble(show_bar_quantities and firstdwn and dwnqty >= min_qty, high,
dwnqty + "\n" 
, color.yellow, yes);


addchartbubble(0 and firstup and upqty >= min_qty, low,
upqty + "\n" +
low + "\n" +
s1 + "\n" +
s2 + "\n" +
s3 + "\n" +
s4 + "\n" +
s5 + "\n" 
, color.yellow, no);

addchartbubble(0 and firstdwn and dwnqty >= min_qty, high,
dwnqty + "\n" +
high + "\n" +
s1 + "\n" +
s2 + "\n" +
s3 + "\n" +
s4 + "\n" +
s5 + "\n" 
, color.yellow, yes);

addchartbubble(0, low,
upqty + "\n" +
dwnqty + "\n" +
high + "\n" +
low + "\n" +
cnt + "\n" +
s1 + " s1\n" +
s2 + "\n" +
s3 + "\n" +
s4 + "\n" +
s5 + "\n" 
, color.yellow, no);

addchartbubble(0, low,
z1 + "\n" +
z2 + "\n" +
z3 + "\n" +
z4 + "\n" +
z5 + "\n" 
, color.yellow, no);

#

PM 15min
G0MuEgi.jpg
 
Here, give this a try. This is something I created a long time ago and don't currently use. It didn't used to draw the zig-zag lines, but I modified it so it does now.

There are a few parameters you can change to pick up bigger/smaller moves. Generally I find leaving swing forward and swing back somewhere between 6-15 is a good place to start.

It also has a feature to draw horizontal lines on the swing points, either just the last swing or all swings. make sure you look at the configuration options / settings and experiment with them a bit.

View attachment 19529

View attachment 19528


Ruby:
# DECLARATIONS
declare upper;

# USER INPUTS
input show_points = yes;
input dot_size = 1;
input dot_distance = 2;
input show_horiz_lines = yes;
input show_zigzag_lines = yes;
input price_type = {default High_Low, Open_Close, Close_Only};
input swing_back = 6;
input swing_forward = 6;
input maxbars = 500;
input sound_alert_on_cross = no;
input show_labels = no;
input show_only_last_swing = yes;


# GLOBAL COLOR DEFINITIONS
DefineGlobalColor("Green", CreateColor(0, 155, 0));
DefineGlobalColor("Red", CreateColor(225, 105, 105));
DefineGlobalColor("Gray", CreateColor(192, 192, 192));


# CALCULATIONS
def sb = swing_back;
def sf = swing_forward;
def na = Double.NaN;

def PriceHigh =
    if price_type == price_type.High_Low then high
    else if price_type == price_type.Open_Close then Max(open, close)
    else if price_type == price_type.Close_Only then close
    else close
;
def PriceLow =
    if price_type == price_type.High_Low then low
    else if price_type == price_type.Open_Close then Min(open, close)
    else if price_type == price_type.Close_Only then close
    else close
;

def lfor = Lowest(PriceLow, sf)[-sf];
def lback = Lowest(PriceLow, sb)[1];
def hfor = Highest(PriceHigh, sf)[-sf];
def hback = Highest(PriceHigh, sb)[1];
def swinglow = if PriceLow < lfor and PriceLow <= lback then yes else no;
def swinghigh = if PriceHigh > hfor and PriceHigh >= hback then yes else no;

def lsl = if IsNaN(close[-sf]) then lsl[1] else if swinglow then PriceLow else lsl[1];
def lsh = if swinghigh then PriceHigh else lsh[1];
def lcount = if swinglow then 1 else lcount[1] + 1;
def hcount = if swinghigh then 1 else hcount[1] + 1;

def slcount = if swinglow then slcount[1] + 1 else slcount[1];
def shcount = if swinghigh then shcount[1] + 1 else shcount[1];
def onlylastslplotbar = slcount == HighestAll(slcount);
def onlylastshplotbar = shcount == HighestAll(shcount);


def lastlowdata =
    if lcount <= maxbars and IsNaN(close[-sf]) then lsl[1]
    else if lcount > maxbars then na
    else if lcount < 2 then na
    else lsl;
def lasthighdata =
    if hcount <= maxbars and IsNaN(close[-sf]) then lsh[1]
    else if hcount > maxbars then na
    else if hcount < 2 then na
    else lsh;

def slData = if swinglow then PriceLow - (dot_distance * TickSize()) else na;
def shData = if swinghigh then PriceHigh + (dot_distance * TickSize()) else na;
def allPointsData = if swinglow then slData else if swinghigh then shData else na;

def lineColorData = if swinglow then 1 else if swinghigh then -1 else lineColorData[1];

# PLOTS
plot sl = slData;
plot sh = shData;
plot lastlow =
    if show_only_last_swing then
        if onlylastslplotbar then
            lastlowdata
        else na
    else
        lastlowdata;
plot lasthigh =
    if show_only_last_swing then
        if onlylastshplotbar then
            lasthighdata
        else na
    else
        lasthighdata;

plot allPoints = allPointsData;

# ALERTS
Alert(high >= lasthigh AND sound_alert_on_cross, "New High", Alert.BAR, Sound.Ding);
Alert(low <= lastlow AND sound_alert_on_cross, "New Low", Alert.BAR, Sound.Ding);


# FORMATTING
sh.SetStyle(curve.points);
sh.SetLineWeight(dot_size);
sh.assignvaluecolor(if SH > lasthigh[1] then GlobalColor("Green") else GlobalColor("Red"));
sh.SetHiding(show_points == No);
sh.HideBubble();
sh.HideTitle();
sl.SetStyle(curve.points);
sl.SetLineWeight(dot_size);
sl.assignvaluecolor(if SL < lastlow[1] then GlobalColor("Red") else GlobalColor("Green"));
sl.SetHiding(show_points == No);
sl.HideBubble();
sl.HideTitle();

lasthigh.SetStyle(curve.SHORT_DASH);
lasthigh.AssignValueColor(GlobalColor("Gray"));
lasthigh.SetHiding(show_horiz_lines == No);
lasthigh.HideBubble();
lasthigh.HideTitle();

lastlow.SetStyle(curve.sHORT_DASH);
lastlow.AssignValueColor(GlobalColor("Gray"));
lastlow.SetHiding(show_horiz_lines == No);
lastlow.HideBubble();
lastlow.HideTitle();

allPoints.AssignValueColor(if lineColorData == -1 then GlobalColor("Red") else if lineColorData == 1 then GlobalColor("Green") else GlobalColor("Gray"));
allPoints.SetHiding(show_zigzag_lines == No);
allPoints.EnableApproximation();
allPoints.HideBubble();
allPoints.HideTitle();
Thank you!! This is very close to what I want actually. In terms of the horizontal lines being drawn, is there a way to limit them to only draw a new low or high if a 2 legged pullback happens in the opposite direction? (an image of a 2 legged pullback is shown in the original screenshot, basically just a move up/down, pivot, and then a HH/LL)

So let's say the high and low are set, if I get a 2 legged pullback going upwards, the new low will be set (bottom of the pullback)

Let me know if this makes sense!


It makes sense, but it may be beyond my coding ability. Any time you have a "first this, then that" situation it can be terribly difficult to code. It gets into tracking variables over time, but specifically resetting them gets tricky.

I don't know if someone else here can do it, but I think it is something I could create.
 

Join useThinkScript to post your question to a community of 21,000+ developers and traders.

Similar threads

Not the exact question you're looking for?

Start a new thread and receive assistance from our community.

87k+ Posts
287 Online
Create Post

Similar threads

Similar threads

The Market Trading Game Changer

Join 2,500+ subscribers inside the useThinkScript VIP Membership Club
  • Exclusive indicators
  • Proven strategies & setups
  • Private Discord community
  • ‘Buy The Dip’ signal alerts
  • Exclusive members-only content
  • Add-ons and resources
  • 1 full year of unlimited support

Frequently Asked Questions

What is useThinkScript?

useThinkScript is the #1 community of stock market investors using indicators and other tools to power their trading strategies. Traders of all skill levels use our forums to learn about scripting and indicators, help each other, and discover new ways to gain an edge in the markets.

How do I get started?

We get it. Our forum can be intimidating, if not overwhelming. With thousands of topics, tens of thousands of posts, our community has created an incredibly deep knowledge base for stock traders. No one can ever exhaust every resource provided on our site.

If you are new, or just looking for guidance, here are some helpful links to get you started.

What are the benefits of VIP Membership?
VIP members get exclusive access to these proven and tested premium indicators: Buy the Dip, Advanced Market Moves 2.0, Take Profit, and Volatility Trading Range. In addition, VIP members get access to over 50 VIP-only custom indicators, add-ons, and strategies, private VIP-only forums, private Discord channel to discuss trades and strategies in real-time, customer support, trade alerts, and much more. Learn all about VIP membership here.
How can I access the premium indicators?
To access the premium indicators, which are plug and play ready, sign up for VIP membership here.
Back
Top