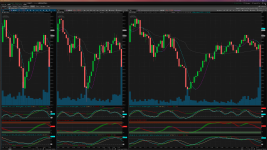
First of all I would really want to thank
@netarchitech for taking the time and creating the two indicators to my specs and those being SMIDSS (Stochastic Momentum Index with DSS line) and the DFS (Double FULL Stochastics). Since I changed the colors of the lines from the original code source I have also included my sharable grid found here
https://tos.mx/r1Zjri6
@horserider also played a role in this so I would also like to extend my thanks.
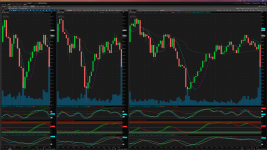
This is a multi time frame strategy with the 15 min being the anchor chart the 10 min being confirmation chart and the 5 min being the more precise dialed in entry and exit chart. Perfect for IntraDay Trading. I have also included the True Momentum Oscillator (TMO) and the HULL Moving Average and VWAP as added indicators to confirm the SMIDSS and DFS studies.
Indicator Settings:
SMIDSS Indicator (5-15 min)
percent D length = 3
percent K length = 5
n2 period 21
r2 period 5
BreakOut Signal on both SMI and AVGSMI
***NOTE***You can use a 14 period for n2 instead of the default 21 on 10-15 min chart for a possible 1 bar scalp assuming both colors on the 10 and 15 min chart are the same.
DFS Indicator (5-15 min)
K period =14
D period =7
slowing period =7
SIMPLE MOVING AVERAGE
***NOTE***Please don't forget to change to Simple Moving Average from the Exponential Moving Average default source code as the default FULL Stochastics found in TOS uses a SMA and not an EMA.
TMO Indicator
5 min:
- Length =14
- Calc length =5
- Smooth lenght =3
10 min:
- Change length to 12 leave the rest the same as 5 min.
15 min:
- Change length to 10 leave the rest the same as 5 min.
HULL Moving Average:
5 min: 21 period
10-15 min: 14 period
The way I would begin to trade using this strategy is on the 15 min chart seeing first what colors the SMIDSS and DFS is...IF both are the same color on the 15 min chart in that specific time I would then move to the 10 min chart and to the same color verification...Lastly before my entry I would use the 5 min chart and make sure that the colors of the DSS line match up on all 3 time frames on. It will happen that the 15 min chart may display the color sooner or later than the 5 min chart. When that happens it is a possibility that the trend might go for a few bars then pull back for another few bars before continuing with the existing trend. Hence it is important to watch the 10 min chart as the confirmation chart of such a pull back. Going strictly off one chart like the 5 min chart you risk not knowing it its a pull back or a reversal unless you watch if the stock is making higher highs and higher lows and vice versa...
Before actually entering into the position please look at the SMI cyan color line and the AVGSMI the mellow yellow line to make sure that the SMI is above the AVGSMI for LONG positions and below the AVGSMI for SHORT positions.
The SMI is a very sensitive indicator by nature and is more precise on higher time frames such as the 10-15min but also works great as an exit indicator on a 5 min if one cannot determine if pull back or a reversal...SO for example if DSS line is either RED or GREEN but the SMI is going in the opposite direction...odds are it is just a small pull back and not a trend reversal. That is why it is also wise to pay attention to the slower setting on the DFS study at the FULLK line and how far away it is from the FULLD line and not just the colored DSS line as that line can sometimes change colors for 1 bar only even on the 10-15 min charts. This unfortunately is also the case with the TMO indicator as we have all seen before from those of us who use it. As much as I like the TMO indicator it can also send fake signals at time when the market is choppy. Having the additional two indicators SMIDSS and DFS will help with such a fake out.
I also put the HULL moving average on there to also avoid a fake out when on the DSS line and the TMO indicator.
More testing will be done in the live market tomorrow...I wanted to take this time to explain a bit for anyone who is interested in watching these indicators tomorrow in a live market setting.
PLEASE REMEMBER That if all the colors on any of the 3 indicators discussed here line up on all 3 time frames at the same time...than enter in the direction of the colors on the 5 min charts and use the SMIDSS indicator as an exit indicator since it will hit the fastest. Any specific questions please ask...This is my first write up and its late so I probably missed something.


