Double Stochastic Indicator for ThinkorSwim

HighBredCloud

Well-known member
@RobertPayne @BenTen
Can either of you gents please help me out? I found a converted Double Stochastics Indicator originally from the Ninja Trader platform that was already converted to TOS...However, its the Slow Stochastics and I am wondering IF there is a way to add on or convert the Double Stochastics from Ninja Trader to a FULL Stochastics that is found in TOS? Not much would need to be done other than adding the "slowing period" and the "break out signals" and possibly change the color of the line from Cyan to Green...

The code can be found here: https://futures.io/thinkorswim/34312-double-stochs-tos-thinkorswim-trading-platform.html
 
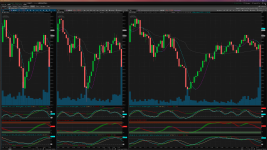
First of all I would really want to thank @netarchitech for taking the time and creating the two indicators to my specs and those being SMIDSS (Stochastic Momentum Index with DSS line) and the DFS (Double FULL Stochastics). Since I changed the colors of the lines from the original code source I have also included my sharable grid found here https://tos.mx/r1Zjri6

@horserider also played a role in this so I would also like to extend my thanks.

This is a multi time frame strategy with the 15 min being the anchor chart the 10 min being confirmation chart and the 5 min being the more precise dialed in entry and exit chart. Perfect for IntraDay Trading. I have also included the True Momentum Oscillator (TMO) and the HULL Moving Average and VWAP as added indicators to confirm the SMIDSS and DFS studies.

Indicator Settings:

SMIDSS Indicator (5-15 min)
percent D length = 3
percent K length = 5

n2 period 21
r2 period 5

BreakOut Signal on both SMI and AVGSMI

***NOTE***You can use a 14 period for n2 instead of the default 21 on 10-15 min chart for a possible 1 bar scalp assuming both colors on the 10 and 15 min chart are the same.

DFS Indicator (5-15 min)

K period =14
D period =7
slowing period =7

SIMPLE MOVING AVERAGE

***NOTE***Please don't forget to change to Simple Moving Average from the Exponential Moving Average default source code as the default FULL Stochastics found in TOS uses a SMA and not an EMA.

TMO Indicator

5 min:

  • Length =14
  • Calc length =5
  • Smooth lenght =3
10 min:
  • Change length to 12 leave the rest the same as 5 min.
15 min:
  • Change length to 10 leave the rest the same as 5 min.

HULL Moving Average:

5 min: 21 period
10-15 min: 14 period

The way I would begin to trade using this strategy is on the 15 min chart seeing first what colors the SMIDSS and DFS is...IF both are the same color on the 15 min chart in that specific time I would then move to the 10 min chart and to the same color verification...Lastly before my entry I would use the 5 min chart and make sure that the colors of the DSS line match up on all 3 time frames on. It will happen that the 15 min chart may display the color sooner or later than the 5 min chart. When that happens it is a possibility that the trend might go for a few bars then pull back for another few bars before continuing with the existing trend. Hence it is important to watch the 10 min chart as the confirmation chart of such a pull back. Going strictly off one chart like the 5 min chart you risk not knowing it its a pull back or a reversal unless you watch if the stock is making higher highs and higher lows and vice versa...

Before actually entering into the position please look at the SMI cyan color line and the AVGSMI the mellow yellow line to make sure that the SMI is above the AVGSMI for LONG positions and below the AVGSMI for SHORT positions.

The SMI is a very sensitive indicator by nature and is more precise on higher time frames such as the 10-15min but also works great as an exit indicator on a 5 min if one cannot determine if pull back or a reversal...SO for example if DSS line is either RED or GREEN but the SMI is going in the opposite direction...odds are it is just a small pull back and not a trend reversal. That is why it is also wise to pay attention to the slower setting on the DFS study at the FULLK line and how far away it is from the FULLD line and not just the colored DSS line as that line can sometimes change colors for 1 bar only even on the 10-15 min charts. This unfortunately is also the case with the TMO indicator as we have all seen before from those of us who use it. As much as I like the TMO indicator it can also send fake signals at time when the market is choppy. Having the additional two indicators SMIDSS and DFS will help with such a fake out.

I also put the HULL moving average on there to also avoid a fake out when on the DSS line and the TMO indicator.

More testing will be done in the live market tomorrow...I wanted to take this time to explain a bit for anyone who is interested in watching these indicators tomorrow in a live market setting.

PLEASE REMEMBER That if all the colors on any of the 3 indicators discussed here line up on all 3 time frames at the same time...than enter in the direction of the colors on the 5 min charts and use the SMIDSS indicator as an exit indicator since it will hit the fastest. Any specific questions please ask...This is my first write up and its late so I probably missed something.

blUyXWn.png
 

Attachments

  • blUyXWn.png
    blUyXWn.png
    484.2 KB · Views: 101
Last edited by a moderator:

Join useThinkScript to post your question to a community of 21,000+ developers and traders.

@HighBredCloud Thank you for the detailed write up!

@BenTen No Problem...I will update this as I do further testing in the next few days...The real thanks should go to ones who helped make this possible. I hope this write up does not confuse people and is helpful...I tried to keep it as simple as possible. The best would be a YouTube video explaining all this...I just need the proper tools to record my screen.
 
@HighBredCloud Looks like you're using a Mac computer. There is already a built-in screen recorder called Quicktime Player. That's what I use to do all my recording. Learn more here: https://support.apple.com/guide/quicktime-player/record-your-screen-qtp97b08e666/mac
I didn't even realize that...I will look into it and make a video as that probably will be the best way to go about the explanation. Thanks for letting me know...literally I learn something new everyday.
 
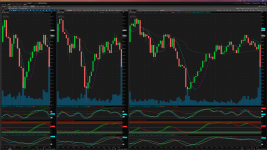
First of all I would really want to thank @netarchitech for taking the time and creating the two indicators to my specs and those being SMIDSS (Stochastic Momentum Index with DSS line) and the DFS (Double FULL Stochastics). Since I changed the colors of the lines from the original code source I have also included my sharable grid found here https://tos.mx/r1Zjri6

@horserider also played a role in this so I would also like to extend my thanks.

This is a multi time frame strategy with the 15 min being the anchor chart the 10 min being confirmation chart and the 5 min being the more precise dialed in entry and exit chart. Perfect for IntraDay Trading. I have also included the True Momentum Oscillator (TMO) and the HULL Moving Average and VWAP as added indicators to confirm the SMIDSS and DFS studies.

Indicator Settings:

SMIDSS Indicator (5-15 min)
percent D length = 3
percent K length = 5

n2 period 21
r2 period 5

BreakOut Signal on both SMI and AVGSMI

***NOTE***You can use a 14 period for n2 instead of the default 21 on 10-15 min chart for a possible 1 bar scalp assuming both colors on the 10 and 15 min chart are the same.

DFS Indicator (5-15 min)

K period =14
D period =7
slowing period =7

SIMPLE MOVING AVERAGE

***NOTE***Please don't forget to change to Simple Moving Average from the Exponential Moving Average default source code as the default FULL Stochastics found in TOS uses a SMA and not an EMA.

TMO Indicator

5 min:

  • Length =14
  • Calc length =5
  • Smooth lenght =3
10 min:
  • Change length to 12 leave the rest the same as 5 min.
15 min:
  • Change length to 10 leave the rest the same as 5 min.

HULL Moving Average:

5 min: 21 period
10-15 min: 14 period

The way I would begin to trade using this strategy is on the 15 min chart seeing first what colors the SMIDSS and DFS is...IF both are the same color on the 15 min chart in that specific time I would then move to the 10 min chart and to the same color verification...Lastly before my entry I would use the 5 min chart and make sure that the colors of the DSS line match up on all 3 time frames on. It will happen that the 15 min chart may display the color sooner or later than the 5 min chart. When that happens it is a possibility that the trend might go for a few bars then pull back for another few bars before continuing with the existing trend. Hence it is important to watch the 10 min chart as the confirmation chart of such a pull back. Going strictly off one chart like the 5 min chart you risk not knowing it its a pull back or a reversal unless you watch if the stock is making higher highs and higher lows and vice versa...

Before actually entering into the position please look at the SMI cyan color line and the AVGSMI the mellow yellow line to make sure that the SMI is above the AVGSMI for LONG positions and below the AVGSMI for SHORT positions.

The SMI is a very sensitive indicator by nature and is more precise on higher time frames such as the 10-15min but also works great as an exit indicator on a 5 min if one cannot determine if pull back or a reversal...SO for example if DSS line is either RED or GREEN but the SMI is going in the opposite direction...odds are it is just a small pull back and not a trend reversal. That is why it is also wise to pay attention to the slower setting on the DFS study at the FULLK line and how far away it is from the FULLD line and not just the colored DSS line as that line can sometimes change colors for 1 bar only even on the 10-15 min charts. This unfortunately is also the case with the TMO indicator as we have all seen before from those of us who use it. As much as I like the TMO indicator it can also send fake signals at time when the market is choppy. Having the additional two indicators SMIDSS and DFS will help with such a fake out.

I also put the HULL moving average on there to also avoid a fake out when on the DSS line and the TMO indicator.

More testing will be done in the live market tomorrow...I wanted to take this time to explain a bit for anyone who is interested in watching these indicators tomorrow in a live market setting.

PLEASE REMEMBER That if all the colors on any of the 3 indicators discussed here line up on all 3 time frames at the same time...than enter in the direction of the colors on the 5 min charts and use the SMIDSS indicator as an exit indicator since it will hit the fastest. Any specific questions please ask...This is my first write up and its late so I probably missed something.
blUyXWn.png
Are you looking for a crossover to signify exiting the trade?
 

Attachments

  • blUyXWn.png
    blUyXWn.png
    484.2 KB · Views: 72
@JBTrades looking for any good signal to either enter or exit a trade as long as it does not fake you out by whipsaw etc...I know there's no perfect indicator but one can always dream right?

I've actually found True Momentum Oscillator with Fisher Transform breakout arrows built in...I am testing this out vs the double stochastics discussed here...So far in my trading it seems to me that the Stochastics Momentum Index with the built in DSS line works much better than the double stochastics...
 
@JBTrades

This is the Stochastic Momentum Index with DSS line that you asked about before...Try this...I think this works better on higher time frames such as 15m+...It can also be used as an exit on 5 min...possible entry but there might be some fake outs...

Stochastic_Momentum_Index

Code:
# original author: TDAmeritrade
# enhancements: netarchitech
# 10.20.2019

declare lower;

input over_bought = 40.0;
input over_sold = -40.0;
input percentDLength = 3;
input percentKLength = 5;
input showBreakoutSignals = {default "No", "On SMI", "On AvgSMI", "On SMI & AvgSMI"};

def min_low = lowest(low, percentKLength);
def max_high = highest(high, percentKLength);
def rel_diff = close - (max_high + min_low)/2;
def diff = max_high - min_low;

def avgrel = expaverage(expaverage(rel_diff, percentDLength), percentDLength);
def avgdiff = expaverage(expaverage(diff, percentDLength), percentDLength);

plot SMI = if avgdiff != 0 then avgrel / (avgdiff / 2) * 100 else 0;
smi.setDefaultColor(getColor(1));
smi.setLineWeight(2);

plot AvgSMI = expaverage(smi, percentDLength);
avgsmi.setDefaultColor(getcolor(5));
avgsmi.setLineWeight(2);

plot overbought = over_bought;
overbought.setDefaultColor(getcolor(4));

plot oversold = over_sold;
oversold.setDefaultColor(getcolor(4));

# Slow Line
input N2_Period = 21;
input R2_Period = 5;

def Ln2 = Lowest(low, N2_Period);
def Hn2 = Highest(high, N2_Period);
def Y2 = ((close - Ln2)/(Hn2 - Ln2)) * 100;
def X2 = ExpAverage(Y2, R2_period);


def Lxn = Lowest(x2, n2_period);
def Hxn = Highest(x2, n2_period);
def DSS = ((X2 - Lxn)/(Hxn - Lxn)) * 100;


def DSSb = ExpAverage(Dss, R2_period);
#DSSb.setdefaultColor(Color.GREEN);

plot DSSsignal = DSSb[1];
DSSsignal.AssignValueColor(if DSSb>DSSsignal then Color.Green else Color.Red);
DSSsignal.SetLineWeight(3);

def upSMI = SMI crosses above OverSold;
def upAvgSMI = AvgSMI crosses above OverSold;
def downSMI = SMI crosses below OverBought;
def downAvgSMI = AvgSMI crosses below OverBought;

plot UpSignal;
plot DownSignal;
switch (showBreakoutSignals) {
case "No":
    UpSignal = Double.NaN;
    DownSignal = Double.NaN;
case "On SMI":
    UpSignal = if upSMI then OverSold else Double.NaN;
    DownSignal = if downSMI then OverBought else Double.NaN;
case "On AvgSMI":
    UpSignal = if upAvgSMI then OverSold else Double.NaN;
    DownSignal = if downAvgSMI then OverBought else Double.NaN;
case "On SMI & AvgSMI":
    UpSignal = if upSMI or upAvgSMI then OverSold else Double.NaN;
    DownSignal = if downSMI or downAvgSMI then OverBought else Double.NaN;
}

UpSignal.setHiding(showBreakoutSignals == showBreakoutSignals."No");
DownSignal.setHiding(showBreakoutSignals == showBreakoutSignals."No");

OverBought.SetDefaultColor(GetColor(4));
OverSold.SetDefaultColor(GetColor(4));
UpSignal.SetDefaultColor(Color.UPTICK);
UpSignal.SetPaintingStrategy(PaintingStrategy.ARROW_UP);
UpSignal.SetLineWeight(3);
DownSignal.SetDefaultColor(Color.DOWNTICK);
DownSignal.SetPaintingStrategy(PaintingStrategy.ARROW_DOWN);
DownSignal.SetLineWeight(3);
 
@HighBredCloud

I had removed my post because I thought it was the built in indicator in TOS. Thank you for posting this!

Yeah I saw your question disappear afterwards...thought I share it anyways in case others needed it...Bit shout out to @netarchitech for making this happen. Try using 21, 7 on setting on the DSS on timeframes lower than 10min...You can also play around with the actual SMI settings to reflect less sensitivity something like 5, 7 from 3, 5
 
Interestingly enough, the conversion code for the NT Double Stochastics references FULL Stochastics:
Code:
plot SlowK = reference StochasticFull(over_bought,over_sold,KPeriod,DPeriod,priceH,priceL,priceC,3,averageType).FullK;
SlowK.setDefaultColor(GetColor(5));

plot SlowD = reference StochasticFull(over_bought,over_sold,KPeriod,DPeriod,priceH,priceL,priceC,3,averageType).FullD;
SlowD.setDefaultColor(GetColor(0));


With that said, you could replace that code with the Full Stochastics code provided by TOS:
Code:
def lowest_k = Lowest(priceL, KPeriod);
def c1 = priceC - lowest_k;
def c2 = Highest(priceH, KPeriod) - lowest_k;
def FastK = if c2 != 0 then c1 / c2 * 100 else 0;

plot FullK = MovingAverage(averageType, FastK, slowing_period);

plot FullD = MovingAverage(averageType, FullK, DPeriod);


The code would now look like this:
Code:
# original author: rmejia
# source: https://futures.io/thinkorswim/34312-double-stochs-tos-thinkorswim-trading-platform.html#post468156

declare lower;

input over_bought = 80;
input over_sold = 20;
input KPeriod = 10;
input DPeriod = 10;
input priceH = high;
input priceL = low;
input priceC = close;
input slowing_period = 3;
input averageType = AverageType.EXPONENTIAL;

def lowest_k = Lowest(priceL, KPeriod);
def c1 = priceC - lowest_k;
def c2 = Highest(priceH, KPeriod) - lowest_k;
def FastK = if c2 != 0 then c1 / c2 * 100 else 0;

plot FullK = MovingAverage(averageType, FastK, slowing_period);

plot FullD = MovingAverage(averageType, FullK, DPeriod);

plot OverBought = over_bought;
OverBought.SetDefaultColor(GetColor(4));

plot OverSold = over_sold;
OverSold.SetDefaultColor(GetColor(4));

# Slow Line
input N2_Period = 21;
input R2_Period = 5;

def Ln2 = Lowest(low, N2_Period);
def Hn2 = Highest(high, N2_Period);
def Y2 = ((close - Ln2)/(Hn2 - Ln2)) * 100;
def X2 = ExpAverage(Y2, R2_period);


def Lxn = Lowest(x2, n2_period);
def Hxn = Highest(x2, n2_period);
def DSS = ((X2 - Lxn)/(Hxn - Lxn)) * 100;


def DSSb = ExpAverage(Dss, R2_period);
#DSSb.setdefaultColor(Color.GREEN);

plot DSSsignal = DSSb[1];
DSSsignal.AssignValueColor(if DSSb>DSSsignal then Color.Cyan else Color.Red);
DSSsignal.SetLineWeight(3);


Hope this helps :)
Nice reply, generous of your time. :)
 
First of all I would really want to thank @netarchitech for taking the time and creating the two indicators to my specs and those being SMIDSS (Stochastic Momentum Index with DSS line) and the DFS (Double FULL Stochastics). Since I changed the colors of the lines from the original code source I have also included my sharable grid found here https://tos.mx/r1Zjri6

@horserider also played a role in this so I would also like to extend my thanks.

This is a multi time frame strategy with the 15 min being the anchor chart the 10 min being confirmation chart and the 5 min being the more precise dialed in entry and exit chart. Perfect for IntraDay Trading. I have also included the True Momentum Oscillator (TMO) and the HULL Moving Average and VWAP as added indicators to confirm the SMIDSS and DFS studies.

Indicator Settings:

SMIDSS Indicator (5-15 min)
percent D length = 3
percent K length = 5

n2 period 21
r2 period 5

BreakOut Signal on both SMI and AVGSMI

***NOTE***You can use a 14 period for n2 instead of the default 21 on 10-15 min chart for a possible 1 bar scalp assuming both colors on the 10 and 15 min chart are the same.

DFS Indicator (5-15 min)

K period =14
D period =7
slowing period =7

SIMPLE MOVING AVERAGE

***NOTE***Please don't forget to change to Simple Moving Average from the Exponential Moving Average default source code as the default FULL Stochastics found in TOS uses a SMA and not an EMA.

TMO Indicator

5 min:

  • Length =14
  • Calc length =5
  • Smooth lenght =3
10 min:
  • Change length to 12 leave the rest the same as 5 min.
15 min:
  • Change length to 10 leave the rest the same as 5 min.

HULL Moving Average:

5 min: 21 period
10-15 min: 14 period

The way I would begin to trade using this strategy is on the 15 min chart seeing first what colors the SMIDSS and DFS is...IF both are the same color on the 15 min chart in that specific time I would then move to the 10 min chart and to the same color verification...Lastly before my entry I would use the 5 min chart and make sure that the colors of the DSS line match up on all 3 time frames on. It will happen that the 15 min chart may display the color sooner or later than the 5 min chart. When that happens it is a possibility that the trend might go for a few bars then pull back for another few bars before continuing with the existing trend. Hence it is important to watch the 10 min chart as the confirmation chart of such a pull back. Going strictly off one chart like the 5 min chart you risk not knowing it its a pull back or a reversal unless you watch if the stock is making higher highs and higher lows and vice versa...

Before actually entering into the position please look at the SMI cyan color line and the AVGSMI the mellow yellow line to make sure that the SMI is above the AVGSMI for LONG positions and below the AVGSMI for SHORT positions.

The SMI is a very sensitive indicator by nature and is more precise on higher time frames such as the 10-15min but also works great as an exit indicator on a 5 min if one cannot determine if pull back or a reversal...SO for example if DSS line is either RED or GREEN but the SMI is going in the opposite direction...odds are it is just a small pull back and not a trend reversal. That is why it is also wise to pay attention to the slower setting on the DFS study at the FULLK line and how far away it is from the FULLD line and not just the colored DSS line as that line can sometimes change colors for 1 bar only even on the 10-15 min charts. This unfortunately is also the case with the TMO indicator as we have all seen before from those of us who use it. As much as I like the TMO indicator it can also send fake signals at time when the market is choppy. Having the additional two indicators SMIDSS and DFS will help with such a fake out.

I also put the HULL moving average on there to also avoid a fake out when on the DSS line and the TMO indicator.

More testing will be done in the live market tomorrow...I wanted to take this time to explain a bit for anyone who is interested in watching these indicators tomorrow in a live market setting.

PLEASE REMEMBER That if all the colors on any of the 3 indicators discussed here line up on all 3 time frames at the same time...than enter in the direction of the colors on the 5 min charts and use the SMIDSS indicator as an exit indicator since it will hit the fastest. Any specific questions please ask...This is my first write up and its late so I probably missed something.

blUyXWn.png
Thanks!
 

Similar threads

Not the exact question you're looking for?

Start a new thread and receive assistance from our community.

87k+ Posts
434 Online
Create Post

Similar threads

Similar threads

The Market Trading Game Changer

Join 2,500+ subscribers inside the useThinkScript VIP Membership Club
  • Exclusive indicators
  • Proven strategies & setups
  • Private Discord community
  • ‘Buy The Dip’ signal alerts
  • Exclusive members-only content
  • Add-ons and resources
  • 1 full year of unlimited support

Frequently Asked Questions

What is useThinkScript?

useThinkScript is the #1 community of stock market investors using indicators and other tools to power their trading strategies. Traders of all skill levels use our forums to learn about scripting and indicators, help each other, and discover new ways to gain an edge in the markets.

How do I get started?

We get it. Our forum can be intimidating, if not overwhelming. With thousands of topics, tens of thousands of posts, our community has created an incredibly deep knowledge base for stock traders. No one can ever exhaust every resource provided on our site.

If you are new, or just looking for guidance, here are some helpful links to get you started.

What are the benefits of VIP Membership?
VIP members get exclusive access to these proven and tested premium indicators: Buy the Dip, Advanced Market Moves 2.0, Take Profit, and Volatility Trading Range. In addition, VIP members get access to over 50 VIP-only custom indicators, add-ons, and strategies, private VIP-only forums, private Discord channel to discuss trades and strategies in real-time, customer support, trade alerts, and much more. Learn all about VIP membership here.
How can I access the premium indicators?
To access the premium indicators, which are plug and play ready, sign up for VIP membership here.
Back
Top