Double Stochastic Indicator for ThinkorSwim

HighBredCloud

Well-known member
@RobertPayne @BenTen
Can either of you gents please help me out? I found a converted Double Stochastics Indicator originally from the Ninja Trader platform that was already converted to TOS...However, its the Slow Stochastics and I am wondering IF there is a way to add on or convert the Double Stochastics from Ninja Trader to a FULL Stochastics that is found in TOS? Not much would need to be done other than adding the "slowing period" and the "break out signals" and possibly change the color of the line from Cyan to Green...

The code can be found here: https://futures.io/thinkorswim/34312-double-stochs-tos-thinkorswim-trading-platform.html
 
First of all I would really want to thank @netarchitech for taking the time and creating the two indicators to my specs and those being SMIDSS (Stochastic Momentum Index with DSS line) and the DFS (Double FULL Stochastics). Since I changed the colors of the lines from the original code source I have also included my sharable grid found here https://tos.mx/r1Zjri6

@horserider also played a role in this so I would also like to extend my thanks.

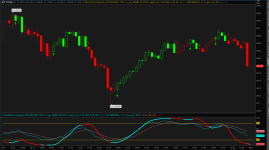
This is a multi time frame strategy with the 15 min being the anchor chart the 10 min being confirmation chart and the 5 min being the more precise dialed in entry and exit chart. Perfect for IntraDay Trading. I have also included the True Momentum Oscillator (TMO) and the HULL Moving Average and VWAP as added indicators to confirm the SMIDSS and DFS studies.
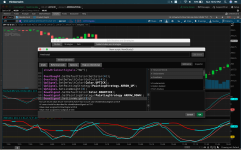
Indicator Settings:

SMIDSS Indicator (5-15 min)
percent D length = 3
percent K length = 5

n2 period 21
r2 period 5

BreakOut Signal on both SMI and AVGSMI

***NOTE***You can use a 14 period for n2 instead of the default 21 on 10-15 min chart for a possible 1 bar scalp assuming both colors on the 10 and 15 min chart are the same.

DFS Indicator (5-15 min)

K period =14
D period =7
slowing period =7

SIMPLE MOVING AVERAGE

***NOTE***Please don't forget to change to Simple Moving Average from the Exponential Moving Average default source code as the default FULL Stochastics found in TOS uses a SMA and not an EMA.

TMO Indicator

5 min:

  • Length =14
  • Calc length =5
  • Smooth lenght =3
10 min:
  • Change length to 12 leave the rest the same as 5 min.
15 min:
  • Change length to 10 leave the rest the same as 5 min.

HULL Moving Average:

5 min: 21 period
10-15 min: 14 period

The way I would begin to trade using this strategy is on the 15 min chart seeing first what colors the SMIDSS and DFS is...IF both are the same color on the 15 min chart in that specific time I would then move to the 10 min chart and to the same color verification...Lastly before my entry I would use the 5 min chart and make sure that the colors of the DSS line match up on all 3 time frames on. It will happen that the 15 min chart may display the color sooner or later than the 5 min chart. When that happens it is a possibility that the trend might go for a few bars then pull back for another few bars before continuing with the existing trend. Hence it is important to watch the 10 min chart as the confirmation chart of such a pull back. Going strictly off one chart like the 5 min chart you risk not knowing it its a pull back or a reversal unless you watch if the stock is making higher highs and higher lows and vice versa...

Before actually entering into the position please look at the SMI cyan color line and the AVGSMI the mellow yellow line to make sure that the SMI is above the AVGSMI for LONG positions and below the AVGSMI for SHORT positions.

The SMI is a very sensitive indicator by nature and is more precise on higher time frames such as the 10-15min but also works great as an exit indicator on a 5 min if one cannot determine if pull back or a reversal...SO for example if DSS line is either RED or GREEN but the SMI is going in the opposite direction...odds are it is just a small pull back and not a trend reversal. That is why it is also wise to pay attention to the slower setting on the DFS study at the FULLK line and how far away it is from the FULLD line and not just the colored DSS line as that line can sometimes change colors for 1 bar only even on the 10-15 min charts. This unfortunately is also the case with the TMO indicator as we have all seen before from those of us who use it. As much as I like the TMO indicator it can also send fake signals at time when the market is choppy. Having the additional two indicators SMIDSS and DFS will help with such a fake out.

I also put the HULL moving average on there to also avoid a fake out when on the DSS line and the TMO indicator.

More testing will be done in the live market tomorrow...I wanted to take this time to explain a bit for anyone who is interested in watching these indicators tomorrow in a live market setting.

PLEASE REMEMBER That if all the colors on any of the 3 indicators discussed here line up on all 3 time frames at the same time...than enter in the direction of the colors on the 5 min charts and use the SMIDSS indicator as an exit indicator since it will hit the fastest. Any specific questions please ask...This is my first write up and its late so I probably missed something.

blUyXWn.png
Thanks!
 

Join useThinkScript to post your question to a community of 21,000+ developers and traders.

@RobertPayne @BenTen
I found a converted Double Stochastics Indicator originally from the Ninja Trader platform that was already converted to TOS...

I am wondering IF there is a way to add on or convert the Double Stochastics from Ninja Trader to a FULL Stochastics that is found in TOS?

Can either of you gents please help me out?

@HighBredCloud I have mentioned it in this thread before; however, people keep asking this. So, let me be explicit. My intent is to help those who are doing the work themselves. I am not here to do the work for you or anyone else.

There are different threads on this forum where other members take on the challenge of writing scripts. If you want me to do it for you, then you can hire me through my website. I take on new clients all the time. In fact, I am working on another proprietary indicator today.
 
Last edited:
The issue is that its the Slow Stochastics and I am wondering IF there is a way to add on or convert the Double Stochastics from Ninja Trader to a FULL Stochastics that is found in TOS?


Interestingly enough, the conversion code for the NT Double Stochastics references FULL Stochastics:
Code:
plot SlowK = reference StochasticFull(over_bought,over_sold,KPeriod,DPeriod,priceH,priceL,priceC,3,averageType).FullK;
SlowK.setDefaultColor(GetColor(5));

plot SlowD = reference StochasticFull(over_bought,over_sold,KPeriod,DPeriod,priceH,priceL,priceC,3,averageType).FullD;
SlowD.setDefaultColor(GetColor(0));


With that said, you could replace that code with the Full Stochastics code provided by TOS:
Code:
def lowest_k = Lowest(priceL, KPeriod);
def c1 = priceC - lowest_k;
def c2 = Highest(priceH, KPeriod) - lowest_k;
def FastK = if c2 != 0 then c1 / c2 * 100 else 0;

plot FullK = MovingAverage(averageType, FastK, slowing_period);

plot FullD = MovingAverage(averageType, FullK, DPeriod);


The code would now look like this:
Code:
# original author: rmejia
# source: https://futures.io/thinkorswim/34312-double-stochs-tos-thinkorswim-trading-platform.html#post468156

declare lower;

input over_bought = 80;
input over_sold = 20;
input KPeriod = 10;
input DPeriod = 10;
input priceH = high;
input priceL = low;
input priceC = close;
input slowing_period = 3;
input averageType = AverageType.EXPONENTIAL;

def lowest_k = Lowest(priceL, KPeriod);
def c1 = priceC - lowest_k;
def c2 = Highest(priceH, KPeriod) - lowest_k;
def FastK = if c2 != 0 then c1 / c2 * 100 else 0;

plot FullK = MovingAverage(averageType, FastK, slowing_period);

plot FullD = MovingAverage(averageType, FullK, DPeriod);

plot OverBought = over_bought;
OverBought.SetDefaultColor(GetColor(4));

plot OverSold = over_sold;
OverSold.SetDefaultColor(GetColor(4));

# Slow Line
input N2_Period = 21;
input R2_Period = 5;

def Ln2 = Lowest(low, N2_Period);
def Hn2 = Highest(high, N2_Period);
def Y2 = ((close - Ln2)/(Hn2 - Ln2)) * 100;
def X2 = ExpAverage(Y2, R2_period);


def Lxn = Lowest(x2, n2_period);
def Hxn = Highest(x2, n2_period);
def DSS = ((X2 - Lxn)/(Hxn - Lxn)) * 100;


def DSSb = ExpAverage(Dss, R2_period);
#DSSb.setdefaultColor(Color.GREEN);

plot DSSsignal = DSSb[1];
DSSsignal.AssignValueColor(if DSSb>DSSsignal then Color.Cyan else Color.Red);
DSSsignal.SetLineWeight(3);


Hope this helps :)
 
@netarchitech I LOVE IT! Thank You So Much For Your Help! You will have good karma coming your way from the trading Gods themselves once you chose to use this indicator. Having the slowing period added to this and making this a FULL Stochastics capable is a night and day difference in terms of not only readability but also the sensitivity of the indicator as per my back testing. I noticed that the slowing period allows for a correction in the sensitivity of the DSS signal.

I have a full strategy behind this particular indicator with conjunction to the True Momentum Oscillator that I am back testing as we speak and once complete I will do a full write up in the strategy section. I will make sure to mention you there as well so you can check it out and give your thoughts on it.

I do have have a possible request if its not too much trouble...The FULL Stochastic in TOS has an option to implement break out signal with the UP and Down arrows...Any way to add that into the code as I find that it would be helpful especially when setting the sensitivity of the K and D periods to settings such as 5, 3, with a slowing period of 3...
 
@HighBredCloud I have mentioned it in this thread before; however, people keep asking this. So, let me be explicit. My intent is to help those who are doing the work themselves. I am not here to do the work for you or anyone else.

There are different threads on this forum where other members take on the challenge of writing scripts. If you want me to do it for you, then you can hire me through my website. I take on new clients all the time. In fact, I am working on another proprietary indicator today.

@RobertPayne I completely understand where you are coming from...BUT that is not what I was asking of you...I just want to clear the air.

I guess I left out a bunch of details in my original post...my appologies. BUT as I previously mentioned I am not a coder by any means...I did attempt to do what I requested to be done and it took me 2 days with no avail...Hence I made a post after 3 AM last Thursday in hopes that one of you coders would help me.

Not everybody is good at coding...let a lone someone like myself who uses practice board for basic HTML...

I am however a full time trader and I do full back testing on indicators to find out what works...what does not and what can be improved on.

I was not asking you to build a whole custom indicator from scratch...IF that were to be the case then I would do what you suggested per your request and I would contact you directly through your site. With that said I personally feel that I threw a bone here to many traders on this site by sharing this particular indicator that I found. My sole intentions AFTER searching this site for a similar indicator and coming out empty handed was to see how such an indicator can be improved using someone like yourself or many others like @netarchitech skill set.

I am may be new here but I can contribute in other ways to this site other than coding...In particular in strategy or back testing of indicators you genius coders throw my way...and I mean that in a good way!

I strongly urge you to take a look at the code @netarchitech just did as per my request...and possibly lets collectively see how else it can be improved. I ONLY say this because when back testing ticker BA from this past Friday...it threw a falls signal around 10:30 CST as it generated an up move when in reality the stock was falling bigly on a 5 min time frame...Other than that...this indicator seems to be solid and probably even more solid now after @netarchitech tweeked it to the FULL Stochastic settings.
 
@HighBredCloud See if this works for arrows.

Code:
# original author: rmejia
# source: https://futures.io/thinkorswim/34312-double-stochs-tos-thinkorswim-trading-platform.html#post468156

declare lower;

input over_bought = 80;
input over_sold = 20;
input KPeriod = 10;
input DPeriod = 10;
input priceH = high;
input priceL = low;
input priceC = close;
input slowing_period = 3;
input averageType = AverageType.EXPONENTIAL;

def lowest_k = Lowest(priceL, KPeriod);
def c1 = priceC - lowest_k;
def c2 = Highest(priceH, KPeriod) - lowest_k;
def FastK = if c2 != 0 then c1 / c2 * 100 else 0;

plot FullK = MovingAverage(averageType, FastK, slowing_period);

plot FullD = MovingAverage(averageType, FullK, DPeriod);

plot OverBought = over_bought;
OverBought.SetDefaultColor(GetColor(4));

plot OverSold = over_sold;
OverSold.SetDefaultColor(GetColor(4));

# Slow Line
input N2_Period = 21;
input R2_Period = 5;

def Ln2 = Lowest(low, N2_Period);
def Hn2 = Highest(high, N2_Period);
def Y2 = ((close - Ln2)/(Hn2 - Ln2)) * 100;
def X2 = ExpAverage(Y2, R2_period);


def Lxn = Lowest(x2, n2_period);
def Hxn = Highest(x2, n2_period);
def DSS = ((X2 - Lxn)/(Hxn - Lxn)) * 100;


def DSSb = ExpAverage(Dss, R2_period);
#DSSb.setdefaultColor(Color.GREEN);

plot DSSsignal = DSSb[1];
DSSsignal.AssignValueColor(if DSSb>DSSsignal then Color.Cyan else Color.Red);
DSSsignal.SetLineWeight(3);

# Add arrows at FullD and FullK crosses of Overbought or Oversold lines Horsrider 10/20/2019


def upD = FullD crosses above OverSold;
def downD = FullD crosses below OverBought;
def upK = FUllK crosses above OverSold;
def downK = FullK crosses below OverBought;

plot UpSignal;
plot DownSignal;
plot UpSignalK;
plot DownSignalK;   

 UpSignal = if upD then OverSold else Double.NaN;
 DownSignal = if downD then OverBought else Double.NaN;
 UpSignalk = if upK then OverSold else Double.NaN;
 DownSignalk = if downK then OverBought else Double.NaN;

UpSignal.SetDefaultColor(Color.LIME);
UpSignal.SetPaintingStrategy(PaintingStrategy.ARROW_UP);
DownSignal.SetDefaultColor(Color.ORANGE);
DownSignal.SetPaintingStrategy(PaintingStrategy.ARROW_DOWN);

UpSignalK.SetDefaultColor(Color.GREEN);
UpSignalK.SetPaintingStrategy(PaintingStrategy.ARROW_UP);
DownSignalK.SetDefaultColor(Color.RED);
DownSignalK.SetPaintingStrategy(PaintingStrategy.ARROW_DOWN);
 
@horserider YES this is perfect! Thank YOU! But any way to have an option under "Show Breakout Signals" drop down menu under inputs section where you can select from the following: NO, On FullK On FullD, On FullK and FullD?

Its exactly the same as in the FULL Stochastics code in TOS if that helps.

The reason I ask this is that some might prefer to have the Breakout Signals under both FullK and FullD while others only on the faster or the slower of the two periods...Again I do not know the extensive work needed to make this happen...So I don't know IF I am asking too much.
 
@HighBredCloud Below please find the completed study. As requested, I incorporated the arrows with the display options...

Again I do not know the extensive work needed to make this happen...

Truth be told, there is no programming/scripting wizardry here. I took the original TOS StochasticsFull study and added the additional "Slow Line" code...That's it :)

Code:
# original author: rmejia
# source: https://futures.io/thinkorswim/34312-double-stochs-tos-thinkorswim-trading-platform.html#post468156

declare lower;

input over_bought = 80;
input over_sold = 20;
input KPeriod = 10;
input DPeriod = 10;
input priceH = high;
input priceL = low;
input priceC = close;
input slowing_period = 3;
input averageType = AverageType.EXPONENTIAL;
input showBreakoutSignals = {default "No", "On FullK", "On FullD", "On FullK & FullD"};

def lowest_k = Lowest(priceL, KPeriod);
def c1 = priceC - lowest_k;
def c2 = Highest(priceH, KPeriod) - lowest_k;
def FastK = if c2 != 0 then c1 / c2 * 100 else 0;

plot FullK = MovingAverage(averageType, FastK, slowing_period);

plot FullD = MovingAverage(averageType, FullK, DPeriod);

plot OverBought = over_bought;
plot OverSold = over_sold;

# Slow Line
input N2_Period = 21;
input R2_Period = 5;

def Ln2 = Lowest(low, N2_Period);
def Hn2 = Highest(high, N2_Period);
def Y2 = ((close - Ln2)/(Hn2 - Ln2)) * 100;
def X2 = ExpAverage(Y2, R2_period);


def Lxn = Lowest(x2, n2_period);
def Hxn = Highest(x2, n2_period);
def DSS = ((X2 - Lxn)/(Hxn - Lxn)) * 100;


def DSSb = ExpAverage(Dss, R2_period);
#DSSb.setdefaultColor(Color.GREEN);

plot DSSsignal = DSSb[1];
DSSsignal.AssignValueColor(if DSSb>DSSsignal then Color.Cyan else Color.Red);
DSSsignal.SetLineWeight(3);

def upK = FullK crosses above OverSold;
def upD = FullD crosses above OverSold;
def downK = FullK crosses below OverBought;
def downD = FullD crosses below OverBought;

plot UpSignal;
plot DownSignal;
switch (showBreakoutSignals) {
case "No":
    UpSignal = Double.NaN;
    DownSignal = Double.NaN;
case "On FullK":
    UpSignal = if upK then OverSold else Double.NaN;
    DownSignal = if downK then OverBought else Double.NaN;
case "On FullD":
    UpSignal = if upD then OverSold else Double.NaN;
    DownSignal = if downD then OverBought else Double.NaN;
case "On FullK & FullD":
    UpSignal = if upK or upD then OverSold else Double.NaN;
    DownSignal = if downK or downD then OverBought else Double.NaN;
}

UpSignal.setHiding(showBreakoutSignals == showBreakoutSignals."No");
DownSignal.setHiding(showBreakoutSignals == showBreakoutSignals."No");

FullK.SetDefaultColor(GetColor(5));
FullD.SetDefaultColor(GetColor(0));
FullK.SetLineWeight(2);
FullD.SetLineWeight(2);
OverBought.SetDefaultColor(GetColor(4));
OverSold.SetDefaultColor(GetColor(4));
UpSignal.SetDefaultColor(Color.UPTICK);
UpSignal.SetPaintingStrategy(PaintingStrategy.ARROW_UP);
UpSignal.SetLineWeight(3);
DownSignal.SetDefaultColor(Color.DOWNTICK);
DownSignal.SetPaintingStrategy(PaintingStrategy.ARROW_DOWN);
DownSignal.SetLineWeight(3);

Hope this helps...

Good Luck and Good Trading :)
 
@netarchitech THIS IS IT! Please feel free to share this indicator with the group here...its AMAZING with the right settings...FYI 14 on FullK and 7 on FullD with a 7 of slowing period works good on 1-5 min charts for a longer trend position...I am testing more so stay tuned! EDIT: Make sure to change to Simple MA from Exponential.

What is your PayPal e-mail? I must send you money for a beer and a pizza for your troubles! Thank You so much...You say its no wizardry but I beg to differ...a noob like me kept getting an error on line 15 when I tried to input the drop down menu for the breakout signals...ANYWAYS...Gonna be testing this now and in the live market tomorrow so I will be sure to leave some feed back.

I am just very curious tho since you are probably very familiar with the stochastics code by now...Do you think its possible to implement just the DSS Signal line to Stochastic Momentum Index study thats found in TOS and to incorporate BreakOut Signals on the Stochastic Moment Index indicator itself?

I am not sure how familiar the rest of the group is with that particular indicator BUT it works really good on higher time frames such as 5 min+. I have been using that particular study as an exit indicator for verification purposes.
 
Hi @HighBredCloud thanks for sharing your ideas and trading strategy. can you share a screenshot on how you trade it, maybe we can help refine it and improved the script.

VkgAILd.png


Are you referring to the DSS line as the cyan/red line? is that the one you want to isolate? Image is 5 min with your 14, 7, 7 setting recommendation.

Maybe create or Ben can move us to a new thread in the strategy section and continue the refinements there.
 

Attachments

  • VkgAILd.png
    VkgAILd.png
    217 KB · Views: 84
@HighBredCloud I am glad to read that the DoubleStochasticsFULL is what you were looking for...Thanks for passing along the settings you use...I'll have to plug them in and check them out :)

No money is necessary for the time/effort spent, just pay it forward...Maybe you could put together a tutorial on strategies and back-testing. Those are two areas in TOS where I find myself totally lacking...

Do you think its possible to implement just the DSS Signal line to Stochastic Momentum Index study thats found in TOS and to incorporate BreakOut Signals on the Stochastic Moment Index indicator itself?

I think it is possible to enhance the Stochastic Momentum Index with the DSS Signal Line...As for the BreakOut Signals, I'll have to look into it a little further...
 
@HighBredCloud Below please find the completed study. As requested, I incorporated the arrows with the display options...

Code:
# Stochastic_Momentum_Index
# original author: TDAmeritrade
# enhancements: netarchitech
# 10.20.2019


declare lower;

input over_bought = 40.0;
input over_sold = -40.0;
input percentDLength = 3;
input percentKLength = 5;
input showBreakoutSignals = {default "No", "On SMI", "On AvgSMI", "On SMI & AvgSMI"};

def min_low = lowest(low, percentKLength);
def max_high = highest(high, percentKLength);
def rel_diff = close - (max_high + min_low)/2;
def diff = max_high - min_low;

def avgrel = expaverage(expaverage(rel_diff, percentDLength), percentDLength);
def avgdiff = expaverage(expaverage(diff, percentDLength), percentDLength);

plot SMI = if avgdiff != 0 then avgrel / (avgdiff / 2) * 100 else 0;
smi.setDefaultColor(getColor(1));
smi.setLineWeight(2);

plot AvgSMI = expaverage(smi, percentDLength);
avgsmi.setDefaultColor(getcolor(5));
avgsmi.setLineWeight(2);

plot overbought = over_bought;
overbought.setDefaultColor(getcolor(4));

plot oversold = over_sold;
oversold.setDefaultColor(getcolor(4));

# Slow Line
input N2_Period = 21;
input R2_Period = 5;

def Ln2 = Lowest(low, N2_Period);
def Hn2 = Highest(high, N2_Period);
def Y2 = ((close - Ln2)/(Hn2 - Ln2)) * 100;
def X2 = ExpAverage(Y2, R2_period);


def Lxn = Lowest(x2, n2_period);
def Hxn = Highest(x2, n2_period);
def DSS = ((X2 - Lxn)/(Hxn - Lxn)) * 100;


def DSSb = ExpAverage(Dss, R2_period);
#DSSb.setdefaultColor(Color.GREEN);

plot DSSsignal = DSSb[1];
DSSsignal.AssignValueColor(if DSSb>DSSsignal then Color.Cyan else Color.Red);
DSSsignal.SetLineWeight(3);

def upSMI = SMI crosses above OverSold;
def upAvgSMI = AvgSMI crosses above OverSold;
def downSMI = SMI crosses below OverBought;
def downAvgSMI = AvgSMI crosses below OverBought;

plot UpSignal;
plot DownSignal;
switch (showBreakoutSignals) {
case "No":
    UpSignal = Double.NaN;
    DownSignal = Double.NaN;
case "On SMI":
    UpSignal = if upSMI then OverSold else Double.NaN;
    DownSignal = if downSMI then OverBought else Double.NaN;
case "On AvgSMI":
    UpSignal = if upAvgSMI then OverSold else Double.NaN;
    DownSignal = if downAvgSMI then OverBought else Double.NaN;
case "On SMI & AvgSMI":
    UpSignal = if upSMI or upAvgSMI then OverSold else Double.NaN;
    DownSignal = if downSMI or downAvgSMI then OverBought else Double.NaN;
}

UpSignal.setHiding(showBreakoutSignals == showBreakoutSignals."No");
DownSignal.setHiding(showBreakoutSignals == showBreakoutSignals."No");

OverBought.SetDefaultColor(GetColor(4));
OverSold.SetDefaultColor(GetColor(4));
UpSignal.SetDefaultColor(Color.UPTICK);
UpSignal.SetPaintingStrategy(PaintingStrategy.ARROW_UP);
UpSignal.SetLineWeight(3);
DownSignal.SetDefaultColor(Color.DOWNTICK);
DownSignal.SetPaintingStrategy(PaintingStrategy.ARROW_DOWN);
DownSignal.SetLineWeight(3);

Hope this helps...

Good Luck and Good Trading :)
 
Last edited:
Just found a couple of typos...corrected and re-posted...Please disregard the previous code...

@HighBredCloud Below please find the completed study. As requested, I incorporated the arrows with the display options...

Code:
# Stochastic_Momentum_Index
# original author: TDAmeritrade
# enhancements: netarchitech
# 10.20.2019


declare lower;

input over_bought = 40.0;
input over_sold = -40.0;
input percentDLength = 3;
input percentKLength = 5;
input showBreakoutSignals = {default "No", "On SMI", "On AvgSMI", "On SMI & AvgSMI"};

def min_low = lowest(low, percentKLength);
def max_high = highest(high, percentKLength);
def rel_diff = close - (max_high + min_low)/2;
def diff = max_high - min_low;

def avgrel = expaverage(expaverage(rel_diff, percentDLength), percentDLength);
def avgdiff = expaverage(expaverage(diff, percentDLength), percentDLength);

plot SMI = if avgdiff != 0 then avgrel / (avgdiff / 2) * 100 else 0;
smi.setDefaultColor(getColor(1));
smi.setLineWeight(2);

plot AvgSMI = expaverage(smi, percentDLength);
avgsmi.setDefaultColor(getcolor(5));
avgsmi.setLineWeight(2);

plot overbought = over_bought;
overbought.setDefaultColor(getcolor(4));

plot oversold = over_sold;
oversold.setDefaultColor(getcolor(4));

# Slow Line
input N2_Period = 21;
input R2_Period = 5;

def Ln2 = Lowest(low, N2_Period);
def Hn2 = Highest(high, N2_Period);
def Y2 = ((close - Ln2)/(Hn2 - Ln2)) * 100;
def X2 = ExpAverage(Y2, R2_period);


def Lxn = Lowest(x2, n2_period);
def Hxn = Highest(x2, n2_period);
def DSS = ((X2 - Lxn)/(Hxn - Lxn)) * 100;


def DSSb = ExpAverage(Dss, R2_period);
#DSSb.setdefaultColor(Color.GREEN);

plot DSSsignal = DSSb[1];
DSSsignal.AssignValueColor(if DSSb>DSSsignal then Color.Cyan else Color.Red);
DSSsignal.SetLineWeight(3);

def upSMI = SMI crosses above OverSold;
def upAvgSMI = AvgSMI crosses above OverSold;
def downSMI = SMI crosses below OverBought;
def downAvgSMI = AvgSMI crosses below OverBought;

plot UpSignal;
plot DownSignal;
switch (showBreakoutSignals) {
case "No":
    UpSignal = Double.NaN;
    DownSignal = Double.NaN;
case "On SMI":
    UpSignal = if upSMI then OverSold else Double.NaN;
    DownSignal = if downSMI then OverBought else Double.NaN;
case "On AvgSMI":
    UpSignal = if upAvgSMI then OverSold else Double.NaN;
    DownSignal = if downAvgSMI then OverBought else Double.NaN;
case "On SMI & AvgSMI":
    UpSignal = if upSMI or upAvgSMI then OverSold else Double.NaN;
    DownSignal = if downSMI or downAvgSMI then OverBought else Double.NaN;
}

UpSignal.setHiding(showBreakoutSignals == showBreakoutSignals."No");
DownSignal.setHiding(showBreakoutSignals == showBreakoutSignals."No");

OverBought.SetDefaultColor(GetColor(4));
OverSold.SetDefaultColor(GetColor(4));
UpSignal.SetDefaultColor(Color.UPTICK);
UpSignal.SetPaintingStrategy(PaintingStrategy.ARROW_UP);
UpSignal.SetLineWeight(3);
DownSignal.SetDefaultColor(Color.DOWNTICK);
DownSignal.SetPaintingStrategy(PaintingStrategy.ARROW_DOWN);
DownSignal.SetLineWeight(3);

Hope this helps...

Good Luck and Good Trading :)
 
Last edited:
@netarchitech I just saw your post with the Stochastic Momentum Index...WOW. That's exactly what I had in mind...BIG THANKS yet again!

OK...Going to write an extensive step by step how I trade using the indicators you helped out with. Please be patient as I will try to get all of this done tonight right after a bit more of back testing to make sure how the Stockastic Momentum Index with the DSS line compares to the Double FULL Stockastics with DSS...At first gland it seems like the Stochastic Momentum Index with the DSS line is the way to go...I just saw that the thread was moved so I will reply there moving forward.
 
@netarchitech I just tried using the new code you provided but looks like there are some errors in it...BTW the old code worked fine so not sure if maybe they just got mixed up? For some reason I cannot attach a pic here using the insert image so please see the link below...

2J0kxL2.png
 

Attachments

  • 2J0kxL2.png
    2J0kxL2.png
    630.3 KB · Views: 83
@diazlaz working on a write up please be patient...will have it done tonight...Just want to get confirmation on the Stochastic Moment Index with the DSS line from @netarchitech and I will go over both of them as to me it seems like the Stochastic Moment Index might be a bit more useful over the Double FULL Stochastic...going over some back tests now to make sure...ALSO try a 9, 5, 5 setting on the Double FULL Stochastic...works good as well and the signal hit a bit faster without being overly sensitive...Make sure to change to a Simple Moving Average from the default Exponential. I will tag you once the write is up done.
 
@HighBredCloud Thanks for the screenshot...This latest code should work...Let me know how it goes...In the meantime, I'm going to run it myself and see what the compiler has to say :)

Code:
# Stochastic_Momentum_Index
# original author: TDAmeritrade
# enhancements: netarchitech
# 10.20.2019


declare lower;

input over_bought = 40.0;
input over_sold = -40.0;
input percentDLength = 3;
input percentKLength = 5;
input showBreakoutSignals = {default "No", "On SMI", "On AvgSMI", "On SMI & AvgSMI"};

def min_low = lowest(low, percentKLength);
def max_high = highest(high, percentKLength);
def rel_diff = close - (max_high + min_low)/2;
def diff = max_high - min_low;

def avgrel = expaverage(expaverage(rel_diff, percentDLength), percentDLength);
def avgdiff = expaverage(expaverage(diff, percentDLength), percentDLength);

plot SMI = if avgdiff != 0 then avgrel / (avgdiff / 2) * 100 else 0;
smi.setDefaultColor(getColor(1));
smi.setLineWeight(2);

plot AvgSMI = expaverage(smi, percentDLength);
avgsmi.setDefaultColor(getcolor(5));
avgsmi.setLineWeight(2);

plot overbought = over_bought;
overbought.setDefaultColor(getcolor(4));

plot oversold = over_sold;
oversold.setDefaultColor(getcolor(4));

# Slow Line
input N2_Period = 21;
input R2_Period = 5;

def Ln2 = Lowest(low, N2_Period);
def Hn2 = Highest(high, N2_Period);
def Y2 = ((close - Ln2)/(Hn2 - Ln2)) * 100;
def X2 = ExpAverage(Y2, R2_period);


def Lxn = Lowest(x2, n2_period);
def Hxn = Highest(x2, n2_period);
def DSS = ((X2 - Lxn)/(Hxn - Lxn)) * 100;


def DSSb = ExpAverage(Dss, R2_period);
#DSSb.setdefaultColor(Color.GREEN);

plot DSSsignal = DSSb[1];
DSSsignal.AssignValueColor(if DSSb>DSSsignal then Color.Cyan else Color.Red);
DSSsignal.SetLineWeight(3);

def upSMI = SMI crosses above OverSold;
def upAvgSMI = AvgSMI crosses above OverSold;
def downSMI = SMI crosses below OverBought;
def downAvgSMI = AvgSMI crosses below OverBought;

plot UpSignal;
plot DownSignal;
switch (showBreakoutSignals) {
case "No":
    UpSignal = Double.NaN;
    DownSignal = Double.NaN;
case "On SMI":
    UpSignal = if upSMI then OverSold else Double.NaN;
    DownSignal = if downSMI then OverBought else Double.NaN;
case "On AvgSMI":
    UpSignal = if upAvgSMI then OverSold else Double.NaN;
    DownSignal = if downAvgSMI then OverBought else Double.NaN;
case "On SMI & AvgSMI":
    UpSignal = if upSMI or upAvgSMI then OverSold else Double.NaN;
    DownSignal = if downSMI or downAvgSMI then OverBought else Double.NaN;
}

UpSignal.setHiding(showBreakoutSignals == showBreakoutSignals."No");
DownSignal.setHiding(showBreakoutSignals == showBreakoutSignals."No");

OverBought.SetDefaultColor(GetColor(4));
OverSold.SetDefaultColor(GetColor(4));
UpSignal.SetDefaultColor(Color.UPTICK);
UpSignal.SetPaintingStrategy(PaintingStrategy.ARROW_UP);
UpSignal.SetLineWeight(3);
DownSignal.SetDefaultColor(Color.DOWNTICK);
DownSignal.SetPaintingStrategy(PaintingStrategy.ARROW_DOWN);
DownSignal.SetLineWeight(3);
 
@netarchitech I just saw both of the codes and it looks like the changes that you made were under the drop down menu for the breakout signals were changed from FULLK and FULLD to SMI and AVG...in either way I am using the code from post #18 right after a few quick back tests...
 

Similar threads

Not the exact question you're looking for?

Start a new thread and receive assistance from our community.

87k+ Posts
482 Online
Create Post

Similar threads

Similar threads

The Market Trading Game Changer

Join 2,500+ subscribers inside the useThinkScript VIP Membership Club
  • Exclusive indicators
  • Proven strategies & setups
  • Private Discord community
  • ‘Buy The Dip’ signal alerts
  • Exclusive members-only content
  • Add-ons and resources
  • 1 full year of unlimited support

Frequently Asked Questions

What is useThinkScript?

useThinkScript is the #1 community of stock market investors using indicators and other tools to power their trading strategies. Traders of all skill levels use our forums to learn about scripting and indicators, help each other, and discover new ways to gain an edge in the markets.

How do I get started?

We get it. Our forum can be intimidating, if not overwhelming. With thousands of topics, tens of thousands of posts, our community has created an incredibly deep knowledge base for stock traders. No one can ever exhaust every resource provided on our site.

If you are new, or just looking for guidance, here are some helpful links to get you started.

What are the benefits of VIP Membership?
VIP members get exclusive access to these proven and tested premium indicators: Buy the Dip, Advanced Market Moves 2.0, Take Profit, and Volatility Trading Range. In addition, VIP members get access to over 50 VIP-only custom indicators, add-ons, and strategies, private VIP-only forums, private Discord channel to discuss trades and strategies in real-time, customer support, trade alerts, and much more. Learn all about VIP membership here.
How can I access the premium indicators?
To access the premium indicators, which are plug and play ready, sign up for VIP membership here.
Back
Top