


Mod Note:
For day traders, the primary challenge isn't finding entry signals—it's maintaining location awareness and avoiding bad risk-reward entries. The core goal is to avoid buying at the absolute top of a range and selling at the bottom.
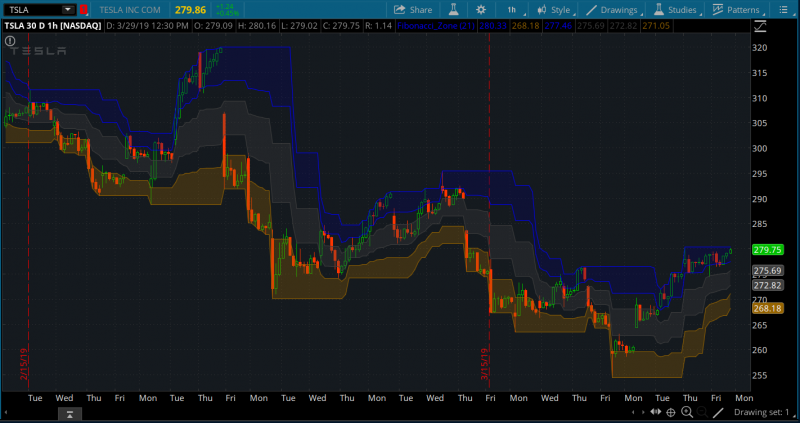
Because this script dynamically anchors Fibonacci zones to a rolling 21-period Donchian Channel, it serves as an intuitive real-time location tool.
Key Trading Rules:
Thanks to WalkingBallista for converting the script.
For day traders, the primary challenge isn't finding entry signals—it's maintaining location awareness and avoiding bad risk-reward entries. The core goal is to avoid buying at the absolute top of a range and selling at the bottom.
Because this script dynamically anchors Fibonacci zones to a rolling 21-period Donchian Channel, it serves as an intuitive real-time location tool.
Key Trading Rules:
- The Value Zone: Treat the Gray Cloud (38.2% – 61.8%) as your primary fair-value area. In a strong intraday trend or gap-up, wait for price to pull back into this zone rather than chasing moves near the top blue cloud.
Dynamic Risk Definition: The bands expand and contract with recent 21-bar volatility. If taking a long trade inside the 38.2%–61.8% zone, the 76.4% level (lf) or Lowest Low (ll) provides a natural, volatility-adjusted stop-loss target. - Anti-FOMO Guardrails: Avoid initiating new long positions inside the top extreme expansion zone (Blue Cloud) or short positions inside the bottom extreme zone (Orange Cloud). Use these zones strictly for scaling out profits or trailing stop losses.
How to Read the Fibonacci Zone Layers:
»Blue Area: Extreme upper expansion zone (Take Profit / Overextended)
»Gray Area: Fair value zone (Optimal Pullback / Entry Area)
»Orange Area: Extreme lower expansion zone (Take Profit / Overextended)
»Outer Bounds: In-between transitional space
Example Trade: The "Gray Zone Reversal" Setup
→Direction: Confirm price is trading above the Daily VWAP (Bullish Bias).
→Location: Wait for price to pull back into the Gray Cloud (38.2% – 61.8%).
→Trigger: Look for a bullish confirmation bar (e.g., a hammer or strong engulfing bar) inside the gray cloud.
→Entry: Break above the high of the confirmation bar.
→Stop Loss: Placed just below the 76.4% band (lf).
→Take Profit: Scale out as price approaches the top High (hl) Blue Cloud.
thinkScript Code
Rich (BB code):
# WalkingBallista
# Converted from: https://www.tradingview.com/script/FDTcR7e9-Fibonacci-Zone/

input length = 21;

plot hl = highest(high, length);
plot ll = lowest(low, length);
def range = hl-ll;
plot hf = hl-range*0.236;
plot cfh = hl-range*0.382;
plot cfl = hl-range*0.618;
plot lf = hl-range*0.764;

DefineGlobalColor("Dark_Blue", createColor(0,0,100));
DefineGlobalColor("Dark_Orange", createColor(150,100,0));
DefineGlobalColor("Dark_Gray", Color.Dark_Gray);
AddCloud(cfh,cfl,GlobalColor("Dark_Gray"));
AddCloud(hl,hf, GlobalColor("Dark_Blue"), GlobalColor("Dark_Blue"));
AddCloud(ll, lf, GlobalColor("Dark_Orange"), GlobalColor("Dark_Orange"));

cfh.setDefaultColor(Color.Dark_Gray);
cfh.setLineWeight(2);
cfl.setDefaultColor(Color.Dark_Gray);
cfl.setLineWeight(2);
hl.setDefaultColor(Color.Blue);
hl.setLineWeight(2);
hf.setDefaultColor(Color.Blue);
hf.setLineWeight(2);
ll.setDefaultColor(GlobalColor("Dark_Orange"));
ll.setLineWeight(2);
lf.setdefaultColor(GlobalColor("Dark_Orange"));
lf.setLineWeight(2);
Shareable Link
https://tos.mx/apRWcvThanks to WalkingBallista for converting the script.
Last edited by a moderator:


