Doji Question

RPrado

Member
Lifetime
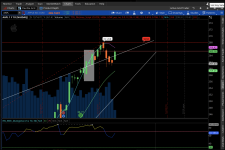
I am looking for a way to measure the body height of the 2nd day in the screenshot shaded area. I also would like a way to indicate on the 3rd day (3rd bar in the shaded area) that volume is equal to or greater than the 1st day.
I hope someone can assist, Thanks,

WvK1KZ5.png
 

Attachments

  • WvK1KZ5.png
    WvK1KZ5.png
    387.8 KB · Views: 79
Last edited by a moderator:
Generally a bodylength can be defined as the following

def bodyLength = absValue(open-close);

For whatever day you're looking for just index it back to the bar you're looking for.
 

Join useThinkScript to post your question to a community of 21,000+ developers and traders.

@tomsk I really appreciate the response, but I have simply no skills in scripting. How would a script be to 1st) trigger the momentum on the 1st bar based on its volume, then 2nd) identify the 2nd bar as similar to a "thick Doji", and 3rd) confirm momentum on the 3rd bar with volume at least equals to the 1st bar (day)? Thanks a lot.
 
note the 1st bar may also be triggered by ttm_squeeze, so I can work with it. My challenge is to spot momentum on the 2nd bar(day) and have a method to confirm momentum on the 3rd. Thanks,
 
I really don't understand what you are looking for. First you seem to want to compare what appears to be a three day moving candle comparison based on volume without a clear definition/logic of the relationship of volume between those 3 candles. Next you make reference to TTM Squeeze. How are candles related to the TTM Squeeze which is another study? Coding is a very precise activity. Suggest you be real clear in your goal, as I don't do piecemeal requests
 
I really don't understand what you are looking for. First you seem to want to compare what appears to be a three day moving candle comparison based on volume without a clear definition/logic of the relationship of volume between those 3 candles. Next you make reference to TTM Squeeze. How are candles related to the TTM Squeeze which is another study? Coding is a very precise activity. Suggest you be real clear in your goal, as I don't do piecemeal requests

I appreciate the honest criticism @tomsk. I will elaborate the description to what I whink will make sense for coding. The 1st day candle height and volume dictates the potential price movement on the 3rd day. The doji like candle in the 2nd day is to be used as trend confirmation and ideally the doji like must open equals to or higher than the 1st day close. The 3rd day candle height has an expectation of running as high as the 1st day, but it is not a guarantee but probability. So, on the 3rd it's expected a volume at least equals to the 1st day candle. A position is taken once the 2nd day doji like confirms trend.

In addition, just to explain my ttm_squeeze mentioning, I use it to scan potential setups for the strategy above.

I hope this is more clear and that you or someone else experienced in coding may be able to assist. Many thanks,
 
Last edited:
@RPrado

It was not a criticism, too often I have seen cases where very loose and imprecise requirements make it difficult to code
That's why you need to be real precise and spell things out explicitly.
Here's what I understood from your rather expanded message.

Day 1 - note the body height and volume
Day 2 - doji - opens at or higher than Day 1's close
Day 3 - volume greater than Day 1's candle

Your explanation while better than the first time round you attempted to do so is still loose
Day 2 doji to me means open and close is the same price. Doji-like to me is not precise enough.
Day 3 candle - there is no mention whether the candle opens/closes up or down relative to candle 2

Hence you need to spell things out explicitly as coding is a very precise activity
 
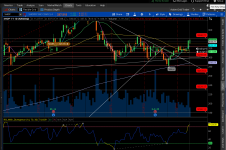
@tomsk The chart below is today's price action in SHOP. I am currently following it to determine if it will form a doji like candle today, which would be 2nd day of this strategy. Ideally, the doji like candle is small in body height, opens above 1st day, and close is below the 3rd day candle open. So, the ideal 3rd day is to open at or above the 2nd day doji like close. I share today's SHOP chart which is supporting this strategy. Thanks,

o3615jL.png
 

Attachments

  • o3615jL.png
    o3615jL.png
    471.4 KB · Views: 70
While this is a better definition for day 2 and 3 you have yet to define how you plan to use the information from day 1's body info.
Until you can have a clear definition in that regard, I can't help you.

The rules for day2 and day3 as you've defined are relatively straightforward and can easily be coded
BTW, SHOP did not close a Doji today
 
Last edited:
Hi. I followed SHOP and had positions on it. Yeah, it did not form the 3rd day for profit. The volume we observe in the 1st day is to be used as guidance on the 3rd day as to whether it will complete the 3Bar. We know SHOP did not. So on the 3rd day we’d expect volume to be equal to or greater than 1sr day. I keep thinking if there’s a better way to track 3rd day, and perhaps you may have better ideas, which I’d also be grateful for. Thank you so much for your support and interest. 😊
 
@tomsk Hi. I hope this updated may help to consider a potential script. So, the 1st day has a massive volume and its volume is to be used as a guidance on the 3rd day to measure the success of the strategy. It is not mandatory, but simply to gage how much volume is to be expected on the 3rd day. I think we have a clear idea of the DOJI like candle on the 2nd day = Day 2 - doji - opens at or higher than Day 1's close. In addition, we must use TTM squeeze as a trigger for entering a position. So, having the DOJI like candle formed, we also must verify a trigger on TTM squeeze. Once it goes 1st day green as shown below it's time for the trader to consider taking a position. So, in summary it's the DOJI like formation and TTM squeeze which together inform the trader of a potential long entry.

I hope this helps and let me know if anything is not clear enough. Thanks a lot,

KS4Q80r.png
 
So I am new here and figured I would contribute a little something...This is a simple script that looks for a doji with a tail at the bottom of a downtrend, the tail usually signifies it dipped enough to wipe out stops then with the liquidity shot back up good way of spotting the bottom you can also use it in a scanner just add it as a custom study and select the plot 'Bullish' and the value to be true.

I use it at the end of the day/week/month but you could use it on shorter time frames no repainting either so the signal is reliable to find the pattern but should be used with other indicators for confirmation. I like this study b/c it doesn't rely on any math or MA's it is looking for a bar pattern which is pretty unique for most studies...

A4JXw3b.png


Here is the code in action...it doesn't catch them all but it is a rather simple code...

Code:
#shadow factor looks for tails based  body height of the candle in a downtrend  the idea was to find tails at the bottom of downtrend setup signifying liquidity being bought

input downtrendSetup = 6; #Number of bars to calculate downtrend slope...not all of these bars have to be descending as long as the overall value is neg it is descending

input shadowFactor = 1; #size of tail in relation to body  higher number less signals can be like .50 for more signals just not below zero or zero


assert(shadowFactor >0, "'shadow factor' must not be negative or zero: " + shadowFactor);

def BodyHeight = BodyHeight();

plot Bullish = IsDescending(close, downtrendSetup) and low<low[1] and low[1]<low[2] and low[2]<low[3]
    and
    Min(open, close) - low > shadowFactor * BodyHeight;

Bullish.SetPaintingStrategy(PaintingStrategy.BOOLEAN_ARROW_UP);
Bullish.SetDefaultColor(GetColor(4));
Bullish.SetLineWeight(2);
 
Last edited by a moderator:
The latest version of TOS? seem to have an option to change the color if the candle is Doji on Appearance tab for the chart settings. Would that replace this indicator?
 

Similar threads

Not the exact question you're looking for?

Start a new thread and receive assistance from our community.

87k+ Posts
264 Online
Create Post

Similar threads

Similar threads

The Market Trading Game Changer

Join 2,500+ subscribers inside the useThinkScript VIP Membership Club
  • Exclusive indicators
  • Proven strategies & setups
  • Private Discord community
  • ‘Buy The Dip’ signal alerts
  • Exclusive members-only content
  • Add-ons and resources
  • 1 full year of unlimited support

Frequently Asked Questions

What is useThinkScript?

useThinkScript is the #1 community of stock market investors using indicators and other tools to power their trading strategies. Traders of all skill levels use our forums to learn about scripting and indicators, help each other, and discover new ways to gain an edge in the markets.

How do I get started?

We get it. Our forum can be intimidating, if not overwhelming. With thousands of topics, tens of thousands of posts, our community has created an incredibly deep knowledge base for stock traders. No one can ever exhaust every resource provided on our site.

If you are new, or just looking for guidance, here are some helpful links to get you started.

What are the benefits of VIP Membership?
VIP members get exclusive access to these proven and tested premium indicators: Buy the Dip, Advanced Market Moves 2.0, Take Profit, and Volatility Trading Range. In addition, VIP members get access to over 50 VIP-only custom indicators, add-ons, and strategies, private VIP-only forums, private Discord channel to discuss trades and strategies in real-time, customer support, trade alerts, and much more. Learn all about VIP membership here.
How can I access the premium indicators?
To access the premium indicators, which are plug and play ready, sign up for VIP membership here.
Back
Top