Doji Question

RPrado

Member
Lifetime
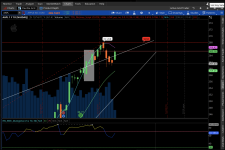
I am looking for a way to measure the body height of the 2nd day in the screenshot shaded area. I also would like a way to indicate on the 3rd day (3rd bar in the shaded area) that volume is equal to or greater than the 1st day.
I hope someone can assist, Thanks,

WvK1KZ5.png
 

Attachments

  • WvK1KZ5.png
    WvK1KZ5.png
    387.8 KB · Views: 91
Last edited by a moderator:
Hi all. Is there anyone who might be willing to help me out with an indicator/pattern script? I am not good at coding, but I've been trying the best I can. This indicator would help reduce the amount of time I spend manually entering price levels. I use these levels as part of a day trading scalp strategy.

What I am trying to do is:
1) Define and identify Doji candles
2) Plot a price level at the close of each Doji candle

I'd like to be able to:
1) Type in the number of days or candles to 'lookback.' That way I can look at a 90 day chart but only get price levels for say 20 days or 10 days etc.
2) Have the price level extend all the way to the right, and all the way to the left if possible.
3) Show a price bubble on the right.

Below is what I have so far. This code is from thinkorswim Doji candle pattern study, and I added some lines based on what I could find from other places in the forum. The problem is the horizontal line ends when a new Doji is formed, but I want the price level to extend all the way to the right. Sometimes they would overlap, but that's ok.
Code:
#
# TD Ameritrade IP Company, Inc. (c) 2011-2020
#
#wizard plots
#wizard text: Inputs: length:
#wizard input: length
#wizard text: trend setup:
#wizard input: trendSetup

input length = 20;
input bodyFactor = 0.05;

Assert(bodyFactor >= 0, "'body factor' must not be negative: " + bodyFactor);

plot Doji = IsDoji(length, bodyFactor);

def mythingdeal = if Doji then close else mythingdeal[1];

plot pricelevel = mythingdeal;

#show price level or extent horizontal line all the way to the right
pricelevel.SetPaintingStrategy(PaintingStrategy.HORIZONTAL);
pricelevel.SetDefaultColor(Color.ORANGE);

Doji.SetPaintingStrategy(PaintingStrategy.bOOLEAN_ARROW_DOWN);
Doji.SetDefaultColor(Color.YELLOW);
Doji.SetLineWeight(3);

0Bxkand.png


Thank you
~Josiah
 
Last edited by a moderator:
here is a link to a study that draws a horizontal line, across the entire chart, at the current price level. copy it, change it, experiment with it, to see how it works.

..highestall() looks for the highest value of something
..there is a formula inside of the highestall() function. IsNaN(vClose[-1]) checks if the next value of close is an error.( the candle after the last one with data). if the next candle has no data, it causes isnan( ) to be true, which causes vclose to be passed on to be evaluated by highestall().

https://usethinkscript.com/threads/current-price-line-indicator-for-thinkorswim.614/

part of that study here
Code:
def vClose = close;
def nan = double.NaN;
def highestClose = HighestAll(if IsNaN(vClose[-1]) then vClose else nan); plot hc = highestClose;

if you want more than 1 line to exist on a candle, you will need a variable for each line.
 
regarding placing a bubble on the right side of the screen. you can use
( barnumber() == highestall(barnumber() )
as the time condition in addchartbubble().
if there is an expansion number set ( settings , time axis) , then a candle won't be at the right edge, so no valid price data. you will have to save an earlier price level , to use in addchartbubble(). ( for experimenting, use a constant)

this link may help. about locating the last bar, future bar
https://usethinkscript.com/threads/only-display-on-current-candle.6343/
 
Last edited:
regarding placing a bubble on the right side of the screen. you can use
( barnumber() == highestall(barnumber() )
as the time condition in addchartbubble().
if there is an expansion number set, then a candle won't be at the right edge, so no valid price data. you will have to save an earlier price level , to use in addchartbubble(). ( for experimenting, use a constant)

this link may help. about locating the last bar, future bar
https://usethinkscript.com/threads/only-display-on-current-candle.6343/
Thank you for the info! I appreciate it. I will research it and see if I get something to work.
 
@j05iah tos doesn't have, at least not that I know of, way to pot line function like pine. This mean to draw one line across entire chart, you have to declare a plot variable for it like price line code.

So for what you want to do, you will have to define how many plots you want, i.e. how many doji plots in lookback period. It's ugly and not really fun coding in thinkscript since thinkscript is very limited/simple.
 
Hello

i am trying to find a pattern where doji candle in the middle of non doji candles. The doji candles can be more than 1 to max 10 (Number of doji candles can be changeable setting in the program) and plot a horizontal line or a box or any thing to highlighted for this candles on any time frame and interval of data. Will really appreciate your help. Thank you
 
I am trying to code and find the available code and modify to my requirement. i found this below code on this site ... take a look. For now i am trying to understand the charts and identify any patterns ...
Ruby:
#
# TD Ameritrade IP Company, Inc. (c) 2011-2020
#
#wizard plots
#wizard text: Inputs: length:
#wizard input: length
#wizard text: trend setup:
#wizard input: trendSetup

input length = 50;
input bodyFactor = 0.50;
Assert(bodyFactor >= 0, "'body factor' must not be negative: " + bodyFactor);
plot Doji = IsDoji(length, bodyFactor);
def mythingdeal = if Doji then close else mythingdeal[1];

plot pricelevel = mythingdeal;
#show price level or extent horizontal line all the way to the right
pricelevel.SetPaintingStrategy(PaintingStrategy.HORIZONTAL);
pricelevel.SetDefaultColor(Color.ORANGE);

Doji.SetPaintingStrategy(PaintingStrategy.bOOLEAN_ARROW_DOWN);
Doji.SetDefaultColor(Color.YELLOW);
Doji.SetLineWeight(3);
 
Last edited by a moderator:

Join useThinkScript to post your question to a community of 21,000+ developers and traders.

Similar threads

Not the exact question you're looking for?

Start a new thread and receive assistance from our community.

87k+ Posts
476 Online
Create Post

Similar threads

Similar threads

The Market Trading Game Changer

Join 2,500+ subscribers inside the useThinkScript VIP Membership Club
  • Exclusive indicators
  • Proven strategies & setups
  • Private Discord community
  • ‘Buy The Dip’ signal alerts
  • Exclusive members-only content
  • Add-ons and resources
  • 1 full year of unlimited support

Frequently Asked Questions

What is useThinkScript?

useThinkScript is the #1 community of stock market investors using indicators and other tools to power their trading strategies. Traders of all skill levels use our forums to learn about scripting and indicators, help each other, and discover new ways to gain an edge in the markets.

How do I get started?

We get it. Our forum can be intimidating, if not overwhelming. With thousands of topics, tens of thousands of posts, our community has created an incredibly deep knowledge base for stock traders. No one can ever exhaust every resource provided on our site.

If you are new, or just looking for guidance, here are some helpful links to get you started.

What are the benefits of VIP Membership?
VIP members get exclusive access to these proven and tested premium indicators: Buy the Dip, Advanced Market Moves 2.0, Take Profit, and Volatility Trading Range. In addition, VIP members get access to over 50 VIP-only custom indicators, add-ons, and strategies, private VIP-only forums, private Discord channel to discuss trades and strategies in real-time, customer support, trade alerts, and much more. Learn all about VIP membership here.
How can I access the premium indicators?
To access the premium indicators, which are plug and play ready, sign up for VIP membership here.
Back
Top