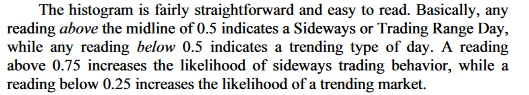
I've been studying the Central Pivot Range (CPR) quite a bit lately and have seen some interest in the "Developing Central Pivot Range (DCPR)" here on usethinkscript, so I went ahead and coded up an indicator that displays the Developing CPR. I created this indicator a while ago and didn't really know what to make of it, but after studying it quite a bit and zooming out on the chart, I think it's really useful, especially when combined with regular CPR.
Typically, CPR is calculated from yesterday's high, low, and close and projected onto today's chart. DCPR shows how the high, low, and close that develop throughout the day end up creating tomorrow's CPR. It provides a visualization of sentiment shift throughout the day and can be effective in knowing when you're likely looking at a pullback versus a trend change. I think it can be useful for intraday trading, including scalping and day swinging.
First, a few notes on the Central Pivot Range that are applicable to the Developing Central Pivot Range as well.
The Central Pivot Range consists of three lines - the Central Pivot (CP), the Bottom Central (BC), and the Top Central (TC). Mathematically,
This indicator plots CP, TC, and BC as the high, low and close for the session develop throughout the day. You'll notice that two of them - TC and CP - are very responsive to price; this is because the close price of the current bar influences 33% of the calculation. BC only changes when new daily highs or new daily lows are made. I've coded this so that when TC is above BC the lines and cloud are green, and when TC is below BC, the lines and cloud are red.
Another important concept with the CPR is the two day relationship - the traditional CPR acts as excellent support and resistance, and when the traditional CPR is higher than the previous period it is an indicator of bullish sentiment; when it is lower than the previous period it is a bearish indicator. When the CPR engulfs the prior day and is wide, you're in for some sideways movement, and when the CPR is narrow, you likely printed a doji on the daily and you're in for a ride.
I mentioned early on that this indicator is best paired with a traditional CPR indicator. This is because it gives you context into the two day relationship that is forming. If the DCPR is above the traditional CPR, you're setting up a bullish two day relationship for the following trading session. If it is below, a bearish two day relationship.
Thus, the DCPR provides excellent visual context for where you are in a trend.
Consider that if you have a Green DCPR trading above the traditional CPR, you are likely in a bullish trend continuation. A Red DCPR trading above the traditional CPR is likely just a pullback - don't go full-on bear mode yet ;-)
The inverse is true when trading below the traditional CPR - a red DCPR is bearish trend continuation, and a green DCPR is probably just a pullback. Until it isn't, of course.
After having studied this, I can think of a few ways to effectively trade it. For day swings, you could enter on pullbacks - red clouds above the traditional CPR, or green clouds below the traditional CPR. The traditional CPR is excellent support and resistance, and with an appropriately sized trade you could use it as your stop loss.
The BC line is also very tradeable. It is HL2 - the midpoint for the day - the 50% retracement from high to low at any point throughout the session. As you study this indicator, you'll find that price interacts with it often, and offers excellent opportunities for entries.
I'd love to hear if you have any thoughts on the DCPR, if you've found it useful, and if there are other good ways to trade it I haven't thought of yet.
Typically, CPR is calculated from yesterday's high, low, and close and projected onto today's chart. DCPR shows how the high, low, and close that develop throughout the day end up creating tomorrow's CPR. It provides a visualization of sentiment shift throughout the day and can be effective in knowing when you're likely looking at a pullback versus a trend change. I think it can be useful for intraday trading, including scalping and day swinging.
First, a few notes on the Central Pivot Range that are applicable to the Developing Central Pivot Range as well.
The Central Pivot Range consists of three lines - the Central Pivot (CP), the Bottom Central (BC), and the Top Central (TC). Mathematically,
- CP = (high + low + close) / 3 (think of this as the HLC3 price of the daily candle)
- BC = (high + low) / 2 (think of this as the HL2 price of the daily candle)
- TC = (CP - BC) + CP (this is the difference between HL2 and HLC3, mirrored across HLC3)
This indicator plots CP, TC, and BC as the high, low and close for the session develop throughout the day. You'll notice that two of them - TC and CP - are very responsive to price; this is because the close price of the current bar influences 33% of the calculation. BC only changes when new daily highs or new daily lows are made. I've coded this so that when TC is above BC the lines and cloud are green, and when TC is below BC, the lines and cloud are red.
Another important concept with the CPR is the two day relationship - the traditional CPR acts as excellent support and resistance, and when the traditional CPR is higher than the previous period it is an indicator of bullish sentiment; when it is lower than the previous period it is a bearish indicator. When the CPR engulfs the prior day and is wide, you're in for some sideways movement, and when the CPR is narrow, you likely printed a doji on the daily and you're in for a ride.
I mentioned early on that this indicator is best paired with a traditional CPR indicator. This is because it gives you context into the two day relationship that is forming. If the DCPR is above the traditional CPR, you're setting up a bullish two day relationship for the following trading session. If it is below, a bearish two day relationship.
Thus, the DCPR provides excellent visual context for where you are in a trend.
Consider that if you have a Green DCPR trading above the traditional CPR, you are likely in a bullish trend continuation. A Red DCPR trading above the traditional CPR is likely just a pullback - don't go full-on bear mode yet ;-)
The inverse is true when trading below the traditional CPR - a red DCPR is bearish trend continuation, and a green DCPR is probably just a pullback. Until it isn't, of course.
After having studied this, I can think of a few ways to effectively trade it. For day swings, you could enter on pullbacks - red clouds above the traditional CPR, or green clouds below the traditional CPR. The traditional CPR is excellent support and resistance, and with an appropriately sized trade you could use it as your stop loss.
The BC line is also very tradeable. It is HL2 - the midpoint for the day - the 50% retracement from high to low at any point throughout the session. As you study this indicator, you'll find that price interacts with it often, and offers excellent opportunities for entries.
I'd love to hear if you have any thoughts on the DCPR, if you've found it useful, and if there are other good ways to trade it I haven't thought of yet.
Code:
# Developing CPR (CPR)
# by bigboss
# Version 1.0

input showTcBcLines = yes;
input showCloud = yes;

def o = open;
def h = high;
def l = low;
def c = close;
def na = Double.NaN;

def today = GetYYYYMMDD();

def rollover = today <> today[1];

def dh = if rollover or h > dh[1] then h else dh[1];
def dl = if rollover or l < dl[1] then l else dl[1];

plot dcp = (dh + dl + c) / 3;
plot dbc = (dh + dl) / 2;
plot dtc = (dcp - dbc) + dcp;

dcp.AssignValueColor(if dtc > dbc then Color.GREEN else Color.RED);
dtc.AssignValueColor(if dtc > dbc then Color.LIGHT_GREEN else Color.LIGHT_RED);
dbc.AssignValueColor(if dtc > dbc then Color.DARK_GREEN else Color.DARK_RED);

AddCloud(if showCloud then dtc else na,if showCloud then dbc else na,Color.LIGHT_GREEN,Color.LIGHT_RED);

dbc.SetHiding(!showTcBcLines);
dtc.SetHiding(!showTcBcLines);

dbc.SetLineWeight(2);")