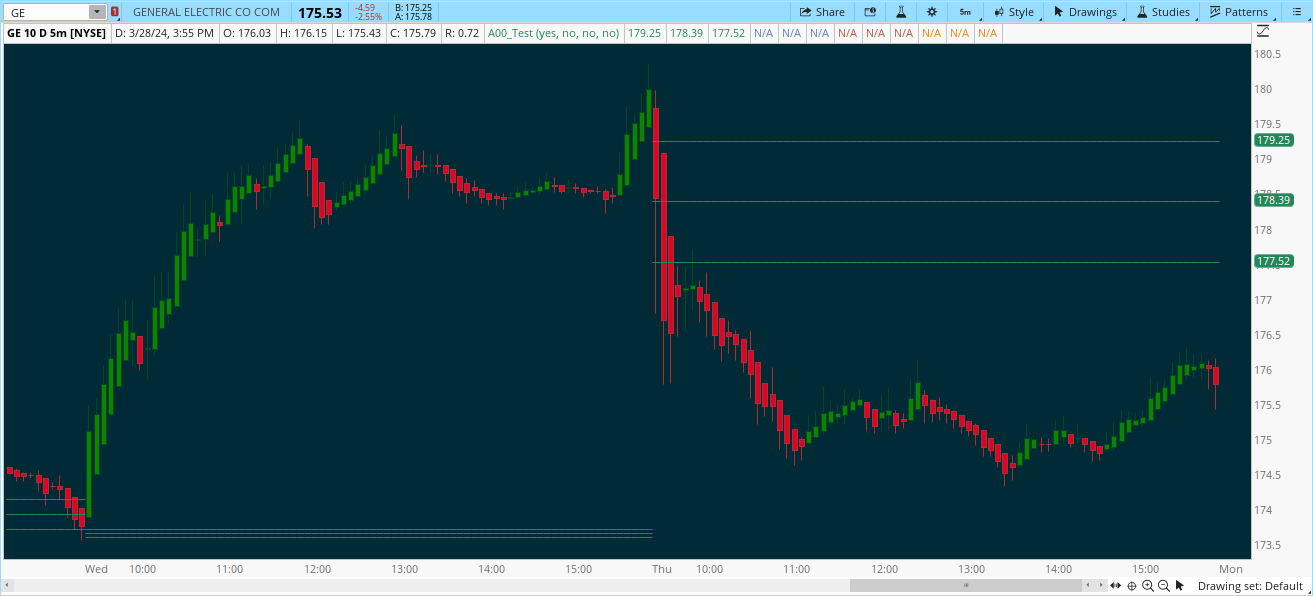
#// Central Pivot Range (CPR) Indicator
#// This script is an implementation of Central Pivot Range described at
# http://pivotboss.com/2010/05/31/a-quick-guide-to-the-pivot-range
#// by Sherwin Daganato, 20171112
#// Inputs:
#// Number of Daily CPR Back - Set the number of calendar days back to plot historical daily CPR. The default value is 7.
#//                            Non-trading days are not taken into account.
#//                            A value of 7, for example, would display only 5 CPR for a 24x5 market.
#// Number of Weekly CPR Back - Set the number of calendar weeks back to plot historical weekly CPR. The default value is 0.
#// Number of Monthly CPR Back - Set the number of calendar months back to plot historical monthly CPR. The default value is 0.
#// Number of Yearly CPR Back - Set the number of calendar years back to plot historical yearly CPR. The default value is 0.
#study(title="SD - Central Pivot Range - Daily Weekly Monthly Yearly", shorttitle="[SD]CPR", overlay=true)
# Converted by Sam4Cok@Samer800

input daily_cpr = yes;
input weekly_cpr = no;
input monthly_cpr = no;
input yearly_cpr = no;

def na = Double.NaN;
def last = isNaN(close);

Script new_period {
input condition = yes;
input src = close;
    def result = if condition then src else result[1];
    plot out = if result then result else Double.NaN;
}
def timenow  = GetAggregationPeriod();
def newDay   = GetDay()!=GetDay()[1];
def newWeek  = GetWeek()!=GetWeek()[1];
def newMonth = GetMonth()!=GetMonth()[1];
def newYear  = GetYear()!=GetYear()[1];

def isintraday = !last and daily_cpr and timenow < AggregationPeriod.DAY;
def isweekly = !last and weekly_cpr and timenow < AggregationPeriod.WEEK;
def ismonthly = !last and monthly_cpr and timenow < AggregationPeriod.MONTH;
def isyearly = !last and yearly_cpr and timenow < AggregationPeriod.YEAR;

def pivotD = (high(Period = "Day") + low(Period = "Day") + close(Period = "Day")) / 3.0;
def bcD = (high(Period = "Day") + low(Period = "Day")) / 2.0;
def tcD = (pivotD - bcD) + pivotD;

def pivotW = (high(Period = "WEEK") + low(Period = "WEEK") + close(Period = "WEEK")) / 3.0;
def bcW = (high(Period = "WEEK") + low(Period = "WEEK")) / 2.0;
def tcW = (pivotW - bcW) + pivotW;

def pivotM = (high(Period = "MONTH") + low(Period = "MONTH") + close(Period = "MONTH")) / 3.0;
def bcM = (high(Period = "MONTH") + low(Period = "MONTH")) / 2.0;
def tcM = (pivotM - bcM) + pivotM;

def pivotY = (high(Period = "YEAR") + low(Period = "YEAR") + close(Period = "YEAR")) / 3.0;
def bcY = (high(Period = "YEAR") + low(Period = "YEAR")) / 2.0;
def tcY = (pivotY - bcY) + pivotY;

#//Daily Central Pivot Range
def dppD = pivotD[1];
def dbcD = bcD[1];
def dtcD = tcD[1];
def dpp_D = new_period(newDay, dppD);
def dtc_D = new_period(newDay, dtcD);
def dbc_D = new_period(newDay, dbcD);
#//Weekly Central Pivot Range
def dppW = pivotW[1];
def dbcW = bcW[1];
def dtcW = tcW[1];
def dpp_W = new_period(newWeek, dppW);
def dtc_W = new_period(newWeek, dtcW);
def dbc_W = new_period(newWeek, dbcW);
#//Monthly Central Pivot Range
def dppM = pivotM[1];
def dbcM = bcM[1];
def dtcM = tcM[1];
def dpp_M = new_period(newMonth, dppM);
def dtc_M = new_period(newMonth, dtcM);
def dbc_M = new_period(newMonth, dbcM);
#//Yearly Central Pivot Range
def dppY = pivotY[1];
def dbcY = bcY[1];
def dtcY = tcY[1];
def dpp_Y = new_period(newYear, dppY);
def dtc_Y = new_period(newYear, dtcY);
def dbc_Y = new_period(newYear, dbcY);

plot DailyTC = if isintraday then (if dtc_D >= dbc_D then dtc_D else dbc_D) else na; #, title="Daily TC"
plot DailyPP = if isintraday then dpp_D else na; #, title="Daily PP"
plot DailyBC = if isintraday then (if dtc_D >= dbc_D then dbc_D else dtc_D) else na; #, title="Daily BC"
DailyTC.SetPaintingStrategy(PaintingStrategy.HORIZONTAL);
DailyPP.SetPaintingStrategy(PaintingStrategy.HORIZONTAL);
DailyBC.SetPaintingStrategy(PaintingStrategy.HORIZONTAL);
DailyTC.SetDefaultColor(CreateColor(35,136,89));
DailyPP.SetDefaultColor(CreateColor(35,136,89));
DailyBC.SetDefaultColor(CreateColor(35,136,89));

plot WeeklyTC = if isWeekly then (if dtc_W >= dbc_W then dtc_W else dbc_W) else na; #, title="Weekly TC"
plot WeeklyPP = if isWeekly then     dpp_W else na; #, title="Weekly PP"
plot WeeklyBC = if isWeekly then (if dtc_W >= dbc_W then dbc_W else dtc_W) else na; #, title="Weekly BC"
WeeklyTC.SetPaintingStrategy(PaintingStrategy.HORIZONTAL);
WeeklyPP.SetPaintingStrategy(PaintingStrategy.HORIZONTAL);
WeeklyBC.SetPaintingStrategy(PaintingStrategy.HORIZONTAL);
WeeklyTC.SetDefaultColor(CreateColor(91,133,191));
WeeklyPP.SetDefaultColor(CreateColor(91,133,191));
WeeklyBC.SetDefaultColor(CreateColor(91,133,191));

plot MonthlyTC = if isMonthly then (if dtc_M >= dbc_M then dtc_M else dbc_M) else na; #, title="Monthly TC"
plot MonthlyPP = if isMonthly then     dpp_M else na; #, title="Monthly PP"
plot MonthlyBC = if isMonthly then (if dtc_M >= dbc_M then dbc_M else dtc_M) else na; #, title="Monthly BC"
MonthlyTC.SetPaintingStrategy(PaintingStrategy.HORIZONTAL);
MonthlyPP.SetPaintingStrategy(PaintingStrategy.HORIZONTAL);
MonthlyBC.SetPaintingStrategy(PaintingStrategy.HORIZONTAL);
MonthlyTC.SetDefaultColor(CreateColor(179,91,70));
MonthlyPP.SetDefaultColor(CreateColor(179,91,70));
MonthlyBC.SetDefaultColor(CreateColor(179,91,70));

plot YearlyTC = if isYearly then (if dtc_Y >= dbc_Y then dtc_Y else dbc_Y) else na; #, title="Yearly TC"
plot YearlyPP = if isYearly then     dpp_Y else na; #, title="Yearly PP"
plot YearlyBC = if isYearly then (if dtc_Y >= dbc_Y then dbc_Y else dtc_Y) else na; #, title="Yearly BC"
YearlyTC.SetPaintingStrategy(PaintingStrategy.HORIZONTAL);
YearlyPP.SetPaintingStrategy(PaintingStrategy.HORIZONTAL);
YearlyBC.SetPaintingStrategy(PaintingStrategy.HORIZONTAL);
YearlyTC.SetDefaultColor(CreateColor(237,134,8));
YearlyPP.SetDefaultColor(CreateColor(237,134,8));
YearlyBC.SetDefaultColor(CreateColor(237,134,8));

#-- END of CODE


