@BenTen and I have been working on different ways to incorporate unusual options flow into our trading. The majority of work I’ve done with flow so far is related to swing trading, but it can also work for scalping as well. Here’s how this strategy works: Ben and I keep a watchlist of mostly large cap tech stocks that we usually watch and trade. I scan this watchlist every day after hours for notable option flows and make a watchlist of any that are likely to move the next day.
This is different from my other UOA work because I am only scanning tickers we are familiar with, not scanning the whole market. Meaning I may not see unusual flow, but I can see if one side has more interest than the other. The goal for this strategy is for scalp trading only. I expect to see a move the very next day, or I’m out of the trade. The data we’ve gathered has been interesting so far and we thought we’d share what we’re working on with the site. We’ve gotten a fairly good success rate on picking stocks that move, but we’re still working on picking the right direction.
For example, our watchlist for Friday 11/8/2019 was

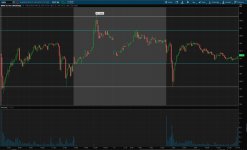
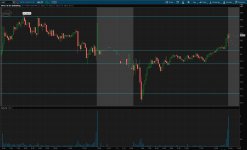
Above is a picture of the 5 minute chart for BABA with some recent support and resistance lines drawn in. Thursday November 7th is the day on the left, the shaded section is aftermarket/premarket, and Friday November 8th is the day on the right. From the last few days of flow, I thought BABA would go down on Friday. To make this simpler to track, I’m saying I’d enter all of these positions at open. I checked the flow in the first 15 minutes of market open, and there’s a lot of flow pointing to the downside. That confirms our earlier thesis and I would hold. I probably would have sold before the price hits the previous support line at about $185.5, but at that point is a great position to exit if you didn’t already.
MU

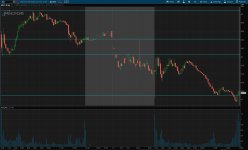
Above is a picture of the 5 minute chart for MU with some recent support and resistance lines drawn in. From the last few days of flow, I thought MU would go up on Friday. First thing we notice is about 5-10 minutes into market open, a lot of flow points to the downside. The next thing that went wrong is MU never broke a previous resistance line at about 6:50 PST. At this point I’d jump out for a small loss.
QCOM

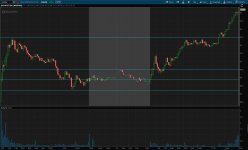
Above is a picture of the 5 minute chart for QCOM with some recent support and resistance lines drawn in. From the last few days of flow, I thought QCOM would go up on Friday. First thing we notice is about 5 minutes into market open, a lot of flow points to the upside. That confirms our thesis that QCOM looks to go up. Second, we see that QCOM doesn’t drop below that lower support line. I’d probably exit at around 9 when we almost hit that resistance line. Better safe than sorry with these scalp profit plays.
ABBV

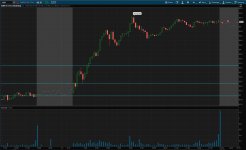
Above is a picture of the 5 minute chart for ABBV with some recent support and resistance lines drawn in. From the last few days of flow, I thought ABBV would go up on Friday. First thing we notice is ABBV pushes past previous resistance and it becomes support. Flow consistently comes up with a bullish thesis, keeping us in the play until we decide to exit and secure profit.
INTC

Above is a picture of the 5 minute chart for INTC with some recent support and resistance lines drawn in. From the last few days of flow, I thought INTC would go up on Friday. First thing we notice that INTC can't seem to break above that previous support line. INTC has lots of short term puts in the first 30 minutes of market open, and we'd probably want to get out at a loss after that first big drop at 7:00 PST. INTC doesn't move much the whole day.
We were right about CVS and wrong about WMT. The actions we would take on those are similar to those above.
Recap
Out of 7 on the watchlist, 6 made significant moves. We called 4 correctly beforehand, and the remaining 3 would be quickly corrected and exited at a small losses.
This is different from my other UOA work because I am only scanning tickers we are familiar with, not scanning the whole market. Meaning I may not see unusual flow, but I can see if one side has more interest than the other. The goal for this strategy is for scalp trading only. I expect to see a move the very next day, or I’m out of the trade. The data we’ve gathered has been interesting so far and we thought we’d share what we’re working on with the site. We’ve gotten a fairly good success rate on picking stocks that move, but we’re still working on picking the right direction.
For example, our watchlist for Friday 11/8/2019 was
- BABA down
- MU up
- QCOM up
- ABBV up
- INTC up
- CVS up
- WMT up
Above is a picture of the 5 minute chart for BABA with some recent support and resistance lines drawn in. Thursday November 7th is the day on the left, the shaded section is aftermarket/premarket, and Friday November 8th is the day on the right. From the last few days of flow, I thought BABA would go down on Friday. To make this simpler to track, I’m saying I’d enter all of these positions at open. I checked the flow in the first 15 minutes of market open, and there’s a lot of flow pointing to the downside. That confirms our earlier thesis and I would hold. I probably would have sold before the price hits the previous support line at about $185.5, but at that point is a great position to exit if you didn’t already.
MU
Above is a picture of the 5 minute chart for MU with some recent support and resistance lines drawn in. From the last few days of flow, I thought MU would go up on Friday. First thing we notice is about 5-10 minutes into market open, a lot of flow points to the downside. The next thing that went wrong is MU never broke a previous resistance line at about 6:50 PST. At this point I’d jump out for a small loss.
QCOM
Above is a picture of the 5 minute chart for QCOM with some recent support and resistance lines drawn in. From the last few days of flow, I thought QCOM would go up on Friday. First thing we notice is about 5 minutes into market open, a lot of flow points to the upside. That confirms our thesis that QCOM looks to go up. Second, we see that QCOM doesn’t drop below that lower support line. I’d probably exit at around 9 when we almost hit that resistance line. Better safe than sorry with these scalp profit plays.
ABBV
Above is a picture of the 5 minute chart for ABBV with some recent support and resistance lines drawn in. From the last few days of flow, I thought ABBV would go up on Friday. First thing we notice is ABBV pushes past previous resistance and it becomes support. Flow consistently comes up with a bullish thesis, keeping us in the play until we decide to exit and secure profit.
INTC
Above is a picture of the 5 minute chart for INTC with some recent support and resistance lines drawn in. From the last few days of flow, I thought INTC would go up on Friday. First thing we notice that INTC can't seem to break above that previous support line. INTC has lots of short term puts in the first 30 minutes of market open, and we'd probably want to get out at a loss after that first big drop at 7:00 PST. INTC doesn't move much the whole day.
We were right about CVS and wrong about WMT. The actions we would take on those are similar to those above.
Recap
Out of 7 on the watchlist, 6 made significant moves. We called 4 correctly beforehand, and the remaining 3 would be quickly corrected and exited at a small losses.
Attachments
Last edited by a moderator:

