// This source code is subject to the terms of the Mozilla Public License 2.0 at https://mozilla.org/MPL/2.0/
// © Dr_Roboto
//
//@version=4
//
// This indicator uses the cyclic smoothed Relative Strength Index (cRSI) instead of the traditional Relative Strength Index (RSI). See below for more info on the benefits to the cRSI.
//
// My key contributions
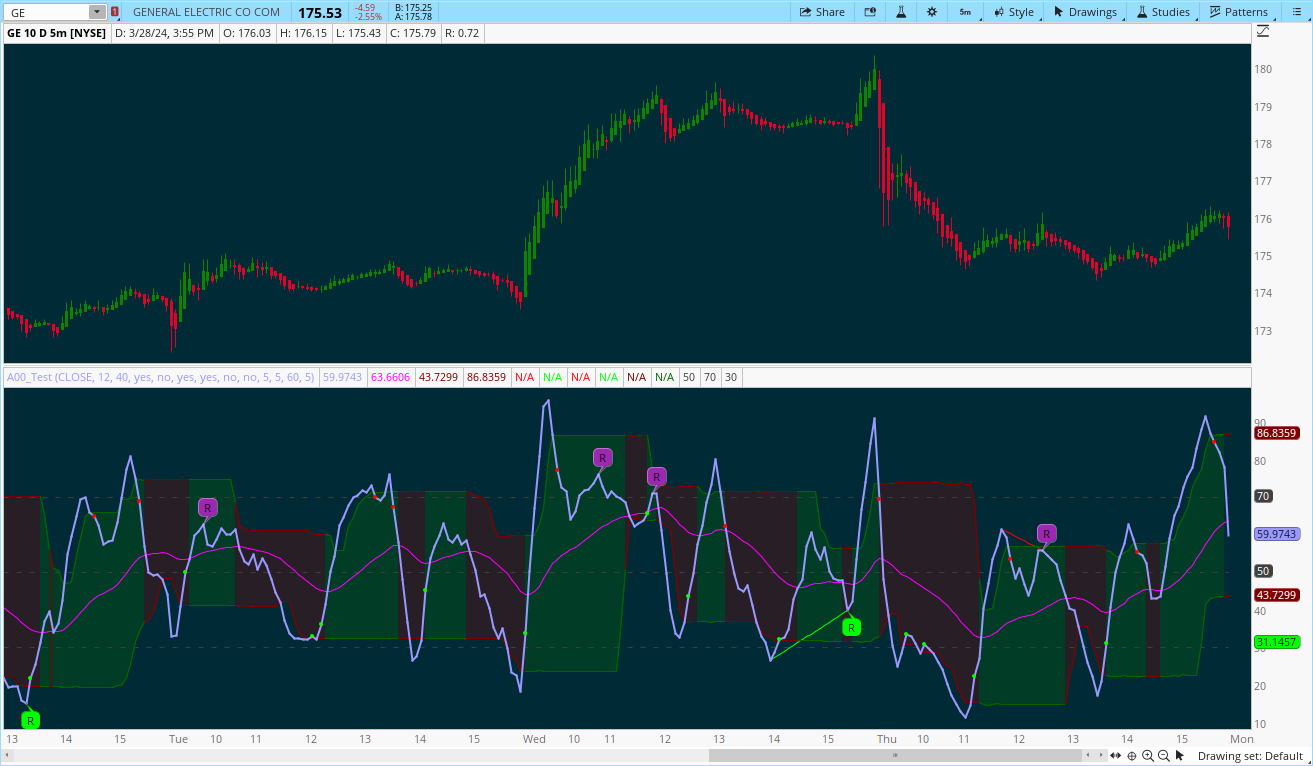
// 1) A Weighted Moving Average (WMA) to track the general trend of the cRSI signal. This is very helpful in determining when the equity switches from bullish to bearish, which can be used to determine buy/sell points.
// This is then is used to color the region between the upper and lower cRSI bands (green above, red below).
// 2) An attempt to detect the motive (impulse) and corrective and waves. Corrective waves are indicated A, B, C, D, E, F, G. F and G waves are not technically Elliot Waves, but the way I detect waves it is really hard
// to always get it right. Once and a while you could actually see G and F a second time. Motive waves are identified as s (strong) and w (weak). Strong waves have a peak above the cRSI upper band and weak waves have a peak below the upper band.
// 3) My own divergence indicator for bull, hidden bull, bear, and hidden bear. I was not able to replicate the TradingView style of drawing a line from peak to peak, but for this indicator I think in the end it makes the chart cleaner.
// 4) I have also added "alert conditions" for most of the key events. Select the equity you want (such as: SPX) and the desired timeframe (such as: D).
// Go to the TradingView "Alerts" tab (click the alarm clock icon) --> Create Alert (alarm clock with a +) --> Change the first condition drop down to "Cyclic Smoothed RSI with Motive-Corrective Wave Indicator" --> in the
// drop down below that select the alert that you want (such as: Bull - cRSI Above WMA). You will want to give the alert a good name that includes the ticker name and time frame, for example "SPX 1D: Bull - cRSI above WMA"
//
// There is a latency issue with an indicator like this that is based on moving averages. That means they tend to trigger right after key events. Perfect timing is not possible strictly with these indicators, but they do work
// very well "on average." However, my implementation has minimal latency as peaks (tops/bottoms) only require one bar to detect.
//
// As a bit of an Easter Egg, this code can be tweaked and run as a strategy to get buy/sell signals. I use this code for both my indicator and for trading strategy. Just copy and past it into a new strategy script and just
// change it from study to something like.
// strategy("cRSI + Waves Strategy with VWMA overlay", overlay=overlay)
// The buy/sell code is at the end and just needs to be uncommented. I make no promises or guarantees about how good it is as a strategy, but it gives you some code and ideas to work with.
//
// Tuning
// 1) Volume Weighted Moving Average (VWMA): This is a “hidden strategy” feature implemented that will display the high-low bands of the VWMA on the price chart if run the code using “overlay = true”.
// - [Use Volume for VWMA] If the equity does not have volume, then the VWMA will not show up. Uncheck this box and it will use the regular WMA (no volume).
// - [VWMA Length] defines how far back the WMA averages price.
//
// 2) cRSI (Black line in the indicator)
// - [CRSI Dominate Cycle Length] Increase to length that amount of time a band (upper/lower) stays high/low after a peak. Reduce the value to shorten the time. Just increment it up/down to see the effect.
// - [CRSI Moving Average Length] defines how far back the SMA averages the cRSI. This affects the purple line in the indicator.
// - [CRSI Top/Bottom Detector Lookback] defines how many bars back the peak detector looks to determine if a peak has occurred. For example, a top is detected like this: current-bar down relative to the 1-bar-back,
// 1-bar-back up relative to 2-bars-back (look back = 1), c) 2-bars-back up relative to 3-bars-back (lookback = 2), and d) 3-bars-back up relative to 4-bars-back (lookback = 3). I hope that makes sense. There are
// only 2 options for this setting: 2 or 3 bars. 2 bars will be able to detect small peaks but create more “false” peaks that may not be meaningful. 3 bars will be more robust but can miss short duration peaks.
//
// 3) Waves
// - The check boxes are self explanatory for which labels they turn on and off on the plot.
//
// 4) Divergence Indicators
// - The check boxes are self explanatory for which labels they turn on and off on the plot.
//
// Hints
// - The most common parameter to change is the [CRSI Top/Bottom Detector Lookback]. Different stocks will have different levels of strength in their peaks. A setting of 2 may generate too many corrective waves.
// - Different times scales will give you different wave counts. This is to be expected. A conunter impulse wave inside a corrective wave may actually go above the cRSI WMA on a smaller time frame. You may need to increase it one or two levels to see large waves.
// - Just because you see divergence (bear or hidden bear) does not mean a price is going to go down. Often price continues to rise through bears, so take note and that is normal. Bulls are usually pretty good indicators especially if you see them on C,E,G waves.
//
//
// ---------------------------------------
// cyclic smoothed RSI (cRSI) indicator
// ---------------------------------------
// The “core” code for the cyclic smoothed RSI (cRSI) indicator was written by Lars von Theinen and is subject to the terms of the Mozilla Public License 2.0 at https://mozilla.org/MPL/2.0/. Copyright (C) 2017 CC BY,
// whentotrade / Lars von Thienen. For more details on the cRSI Indicator: https://www.tradingview.com/script/TmqiR1jp-RSI-cyclic-smoothed-v2/
//
// The cyclic smoothed RSI indicator is an enhancement of the classic RSI, adding
// 1) additional smoothing according to the market vibration,
// 2) adaptive upper and lower bands according to the cyclic memory and
// 3) using the current dominant cycle length as input for the indicator.
// It is much more responsive to market moves than the basic RSI. The indicator uses the dominant cycle as input to optimize signal, smoothing, and cyclic memory. To get more in-depth information on the cyclic-smoothed
// RSI indicator, please read Decoding The Hidden Market Rhythm - Part 1: Dynamic Cycles (2017), Chapter 4: "Fine-tuning technical indicators." You need to derive the dominant cycle as input parameter for the cycle length as described in chapter 4.
//=================================================================================================================================
//=================================================================================================================================
overlay = true // plots VWMA (need to close and re-added)
// overlay = false // plots cRSI (need to close and re-added)
strategy("cRSI + Waves Strategy with VWMA overlay", overlay=overlay, max_bars_back=300)
//=================================================================================================================================
//=================================================================================================================================
// Disables cRSI and VWMA plotting so debug data can be plotted
// DEBUG = true
DEBUG = false
//=================================================================================================================================
//=================================================================================================================================
// Helper Functions
//=================================================================================================================================
//=================================================================================================================================
// function to convert bool to int
b2i(bval) =>
ival = bval ? 1 : 0
// function to look for a price in the lookback that is recently above the current price
recentAbove(in, thresh, lookback) =>
found = false
for i=0 to lookback
if in >= thresh
found := true
break
if found
res = true
else
res = false
// is value rising or falling based on history
isRisingFalling(in, lookback) =>
cntThresh = round(lookback*0.6) // majority = greater than 50%
cntUp = 0
cntDown = 0
rising = false
falling = false
// count up the times it is above or below the current value
for i=1 to lookback
if in[0] > in
cntUp := cntUp + 1
else if in[0] < in
cntDown := cntDown + 1
// rising
if cntUp > cntThresh
rising := true
else
rising := false
// falling
if cntDown > cntThresh
falling := true
else
falling := false
// flat
flat = not(rising) and not(falling)
// if flat, then select preivous value for rising and falling
if flat
rising := rising[1]
falling := falling[1]
// return tuple
[rising,falling,flat]
// Do the last several prices form a top
isTop(price, lookback) =>
if lookback == 3
// 3 prices back -> 3rd check helps ensure there was a down trend, but can miss some small reversals
// up->up->down
if (price[2] > price[3]) and (price[1] > price[2]) and (price[0] < price[1])
top = true
else
top = false
else
// 2 places back
// up->down
if (price[1] > price[2]) and (price[0] < price[1])
top = true
else
top = false
// Do the last several prices form a bottom
isBottom(price, lookback) =>
if lookback == 3
// 3 prices back -> 3rd check helps ensure there was a down trend, but can miss some small reversals
// down->down->up
if (price[2] < price[3]) and (price[1] < price[2]) and (price[0] > price[1])
bottom = true
else
bottom = false
else
// 2 prices back
// down->up
if (price[1] < price[2]) and (price[0] > price[1])
bottom = true
else
bottom = false
// function to filter multiple signals in a row
filterSignal(signalFlag, lookback) =>
signalFlagFilt = signalFlag
for i = 1 to lookback
signalFlagFilt := signalFlagFilt[0] == true and signalFlagFilt == true ? false : signalFlagFilt
//=================================================================================================================================
//=================================================================================================================================
// Price Movement
//=================================================================================================================================
//=================================================================================================================================
priceRising = close[0] >= close[1] and close[1] >= close[2]
priceFalling = close[0] <= close[1] and close[1] <= close[2]
// plot(priceRising?1.0:0,color=color.green)
// plot(priceFalling?1.0:0,color=color.red)
//=================================================================================================================================
//=================================================================================================================================
// Volume Weighted Moving Average (VWMA)
//=================================================================================================================================
//=================================================================================================================================
plotVWMA = overlay and not(DEBUG)
// check if volume is available for this equity
useVolume = input(title="Use Volume for VWMA (uncheck if equity does not have volume)", defval=true)
vwmaLen = input(defval=21, title="VWMA Length", type=input.integer, minval=1, maxval=200)
vwma = vwma(close, vwmaLen)
vwma_high = vwma(high, vwmaLen)
vwma_low = vwma(low, vwmaLen)
if not(useVolume)
vwma := wma(close, vwmaLen)
vwma_high := wma(high, vwmaLen)
vwma_low := wma(low, vwmaLen)
// +1 when above, -1 when below, 0 when inside
vwmaSignal(priceOpen, priceClose, vwmaHigh, vwmaLow) =>
sig = 0
color = color.gray
if priceClose > vwmaHigh
sig := 1
color := color.green
else if priceClose < vwmaLow
sig := -1
color := color.red
else
sig := 0
color := color.gray
[sig,color]
[vwma_sig, vwma_color] = vwmaSignal(open, close, vwma_high, vwma_low)
priceAboveVWMA = vwma_sig == 1 ? true : false
priceBelowVWMA = vwma_sig == -1 ? true : false
// plot(priceAboveVWMA?2.0:0,color=color.blue)
// plot(priceBelowVWMA?2.0:0,color=color.maroon)
// bandTrans = input(defval=70, title="VWMA Band Transparancy (100 invisible)", type=input.integer, minval=0, maxval=100)
// fillTrans = input(defval=70, title="VWMA Fill Transparancy (100 invisible)", type=input.integer, minval=0, maxval=100)
bandTrans = 70
fillTrans = 70
// ***** Plot VWMA *****
highband = plot(plotVWMA?fixnan(vwma_high):na, title='VWMA High band', color = vwma_color, linewidth=1, transp=bandTrans)
lowband = plot(plotVWMA?fixnan(vwma_low):na, title='VWMA Low band', color = vwma_color, linewidth=1, transp=bandTrans)
fill(lowband, highband, title='VWMA Band fill', color=vwma_color, transp=fillTrans)
plot(plotVWMA?vwma:na, title='VWMA', color = vwma_color, linewidth=3, transp=0)
//=================================================================================================================================
//=================================================================================================================================
// Moving Average (VWMA)
//=================================================================================================================================
//=================================================================================================================================
smaLineWidth = 8
smaLen1 = input(defval=50, title="SMA #1 Length", type=input.integer, minval=1, maxval=200)
plot(sma(close,smaLen1), title='SMA', color = color.blue, linewidth=smaLineWidth)
smaLen2 = input(defval=100, title="SMA #2 Length", type=input.integer, minval=1, maxval=200)
plot(sma(close,smaLen2), title='SMA', color = color.black, linewidth=smaLineWidth)
//=================================================================================================================================
//=================================================================================================================================
// Moving Average Convergence Divergence (MACD)
//=================================================================================================================================
//=================================================================================================================================
[macdLine, signalLine, histLine] = macd(close, 12, 26, 9)
// Is the histogram rising or falling
histLineRising = histLine[0] >= histLine[1] and histLine[1] >= histLine[2]
histLineFalling = histLine[0] <= histLine[1] and histLine[1] <= histLine[2]
// Did the histogram cross over zero
histLineCrossNeg2Pos = histLine[0] >= 0.0 and histLine[1] < 0.0
histLineCrossPos2Neg = histLine[0] <= 0.0 and histLine[1] > 0.0
// plot(histLineRising?1.0:0,color=color.green)
// plot(histLineFalling?1.0:0,color=color.red)
// plot(histLineCrossNeg2Pos?1.0:0,color=color.green)
// plot(histLineCrossPos2Neg?1.0:0,color=color.red)
//=================================================================================================================================
//=================================================================================================================================
// Cyclic Smoothed Relative Strength Index (cRSI)
//=================================================================================================================================
//=================================================================================================================================
plotCRSI = not(overlay) and not(DEBUG)
//src = input(title="cRSI Source", defval=close)
src = close
domcycle = input(10, minval=5, title="cRSI Dominant Cycle Length (persist after high/low)") //12
crsi = 0.0
cyclelen = domcycle / 2
vibration = 10
leveling = 10.0
cyclicmemory = domcycle * 2
//set min/max ranges?
torque = 2.0 / (vibration + 1)
phasingLag = (vibration - 1) / 2.0
up = rma(max(change(src), 0), cyclelen)
down = rma(-min(change(src), 0), cyclelen)
rsi = down == 0 ? 100 : up == 0 ? 0 : 100 - 100 / (1 + up / down)
crsi := torque * (2 * rsi - rsi[phasingLag]) + (1 - torque) * nz(crsi[1])
// there is a bug that can cause the lower bound to be bigger than the upper bound with a value of 999999.0
// lmax = -999999.0
// lmin = 999999.0
lmax = 0.0 // don't konw why, but this fixes the bug
lmin = 0.0
for i = 0 to cyclicmemory - 1 by 1
if nz(crsi, -999999.0) > lmax
lmax := nz(crsi)
lmax
else
if nz(crsi, 999999.0) < lmin
lmin := nz(crsi)
lmin
mstep = (lmax - lmin) / 100
aperc = leveling / 100
crsiLowband = 0.0
for steps = 0 to 100 by 1
testvalue = lmin + mstep * steps
above = 0
below = 0
for m = 0 to cyclicmemory - 1 by 1
below := below + iff(crsi[m] < testvalue, 1, 0)
below
ratio = below / cyclicmemory
if ratio >= aperc
crsiLowband := testvalue
break
else
continue
crsiHighband = 0.0
for steps = 0 to 100 by 1
testvalue = lmax - mstep * steps
above = 0
for m = 0 to cyclicmemory - 1 by 1
above := above + iff(crsi[m] >= testvalue, 1, 0)
above
ratio = above / cyclicmemory
if ratio >= aperc
crsiHighband := testvalue
break
else
continue
//=================================================================================================================================
//=================================================================================================================================
// cRSI moving average
//=================================================================================================================================
//=================================================================================================================================
crsiMaLen = input(title="cRSI Moving Average Length", defval=50, minval=0, step=5, type=input.integer)
// crsiSMA = sma(crsi,crsiMaLen)
// crsiEMA = ema(crsi,crsiMaLen)
crsiWMA = wma(crsi,crsiMaLen)
// plot(crsiSMA, "CRSI SMA", color.red, linewidth=2)
// plot(crsiEMA, "CRSI EMA", color.green, linewidth=2)
// plot(crsiWMA, "CRSI WMA", color.fuchsia, linewidth=2)
//=================================================================================================================================
//=================================================================================================================================
// cRSI Feature Analysis
//=================================================================================================================================
//=================================================================================================================================
// Crossing of upper band
crsiAboveHighband = crsi >= crsiHighband
crsiBelowHighband = not(crsiAboveHighband)
crsiCrossAboveHighband = crsiAboveHighband[0] and crsiBelowHighband[1] ? true : false
crsiCrossBelowHighband = crsiBelowHighband[0] and crsiAboveHighband[1] ? true : false
// plot(crsiAboveHighband?2.0:0,color=color.black)
// plot(crsiBelowHighband?2.25:0,color=color.red)
// plot(crsiCrossAboveHighband?2.5:0,color=color.green)
// plot(crsiCrossBelowHighband?2.75:0,color=color.blue)
//-----------------------------------------------------------------------------
// Crossing of lower band
crsiAboveLowband = crsi >= crsiLowband
crsiBelowLowband = not(crsiAboveLowband)
crsiCrossAboveLowband = crsiAboveLowband[0] and crsiBelowLowband[1] ? true : false
crsiCrossBelowLowband = crsiBelowLowband[0] and crsiAboveLowband[1] ? true : false
// plot(crsiAboveLowband?1.0:0,color=color.black)
// plot(crsiBelowLowband?1.25:0,color=color.red)
// plot(crsiCrossAboveLowband?1.5:0,color=color.green)
// plot(crsiCrossBelowLowband?1.75:0,color=color.blue)
//-----------------------------------------------------------------------------
// Crossing of WMA
crsiAboveWMA = crsi >= crsiWMA
crsiBelowWMA = not(crsiAboveWMA)
crsiCrossAboveWMA = crsiAboveWMA[0] and crsiBelowWMA[1] ? true : false
crsiCrossBelowWMA = crsiBelowWMA[0] and crsiAboveWMA[1] ? true : false
// plot(crsiAboveWMA?1.0:0,color=color.black)
// plot(crsiBelowWMA?1.25:0,color=color.red)
// plot(crsiCrossAboveWMA?1.5:0,color=color.blue)
// plot(crsiCrossBelowWMA?1.75:0,color=color.maroon)
//-----------------------------------------------------------------------------
// Crossing of 50 level
crsiAbove50 = crsi >= 50
crsiBelow50 = not(crsiAbove50)
crsiCrossAbove50 = crsiAbove50[0] and crsiBelow50[1] ? true : false
crsiCrossBelow50 = crsiBelow50[0] and crsiAbove50[1] ? true : false
//-----------------------------------------------------------------------------
// CRSI falling or rising
crsiRising = crsi[0] >= crsi[1]
crsiFalling = crsi[0] < crsi[1]
// plot(crsiRising?3.0:0,color=color.green)
// plot(crsiFalling?3.0:0,color=color.red)
//-----------------------------------------------------------------------------
// Compare cRSI to crsiWMA to determine if equity is bullish (motive) or bearish (corrective)
bull = crsiAboveWMA
bear = not(bull)
bullBearColor = bull ? color.green : color.red
bullStart = bull[0] and bear[1] ? true : false
bearStart = bear[0] and bull[1] ? true : false
alertcondition(bullStart, title='Bull - cRSI above WMA', message='Bull - cRSI above WMA')
alertcondition(bearStart, title='Bear - cRSI below WMA', message='Bear - cRSI below WMA')
//=================================================================================================================================
//=================================================================================================================================
// Plot cRSI colored by Bull or Bear
//=================================================================================================================================
//=================================================================================================================================
// Basic RSI
hline(plotCRSI?50:na, title="Middle Line", linestyle=hline.style_dashed, linewidth=2)
h2 = hline(plotCRSI?70:na, title="Overbought", linestyle=hline.style_dashed, linewidth=2)
h1 = hline(plotCRSI?30:na, title="Oversold", linestyle=hline.style_dashed, linewidth=2)
fill(h1, h2, color=color.silver, transp=80)
// cRSI
crsiLB2 = plot(plotCRSI?crsiLowband:na, "cRSI LowBand", bullBearColor)
crsiHB2 = plot(plotCRSI?crsiHighband:na, "cRSI HighBand", bullBearColor)
fill(crsiLB2, crsiHB2, bullBearColor, transp=75)
plot(plotCRSI?crsiWMA:na, "CRSI WMA", color.fuchsia, linewidth=2)
plot(plotCRSI?crsi:na, "CRSI", color.black, linewidth=4)
//=================================================================================================================================
//=================================================================================================================================
// Moitve (impulse) and Corrective Waves
//=================================================================================================================================
//=================================================================================================================================
// THIS IS A MAJOR ASSUMPTION TO THIS APPROACH!!!
motiveWave = bull
correctiveWave = bear
// TOP AND BOTTOM ARE DETECTED ONE BAR LATE!!!
topBottomLookback = input(title="cRSI Top/Bottom Detector Lookback (3 is more robust but misses smaller)", defval=2, minval=2, maxval=3, step=1, type=input.integer)
crsiTop = isTop(crsi, topBottomLookback)
crsiBottom = isBottom(crsi,topBottomLookback)
// Top above high band
crsiTopAboveHighband = crsiTop and crsiAboveHighband[1]
waveStrongImpulse = crsiTopAboveHighband
// Top that does not break high band but is above WMA
crsiTopBelowHighband = (crsiTop and crsiBelowHighband[1]) and (crsi > crsiWMA)
waveWeakImpulse = crsiTopBelowHighband
//-----------------------------------------------------------------------------
// Determine the ABC, ABCDE, ABCDEFG sequence
// Note that ABCDEFG is not a true Elliott corrective wave sequence, but for this approach is shows up once in a blue moon
possibleWaveA = crsiBottom and crsiBelowLowband[1]
possibleWaveB = (crsiTop and crsiBelowWMA[1]) or (crsiTop and crsiBelow50[1]) // Also catch the tops that are above wma but stay under RSI 50 (rare)
possibleWaveC = possibleWaveA or (crsiBottom and crsiBelowWMA[1]) // sometimes wave C is above the lower band but below the WMA
// Wave AB
findWaveAB(possibleWaveA, possibleWaveB, correctiveWave) =>
isWaveAB = false
foundMatch = false
// start with Wave B
if possibleWaveB
// search backwards and look for wave A
for i=1 to 50
// Equity must be in correction else invalidated
if correctiveWave
if possibleWaveA
foundMatch := true
break
//else
// keep looping
else
// motive wave invalidates search
foundMatch := false
break
// Did we match an A and B wave?
if foundMatch
isWaveAB := true
else
isWaveAB := false
else
isWaveAB := false
waveAB = findWaveAB(possibleWaveA, possibleWaveB, correctiveWave)
// Wave ABC
findWaveABC(possibleWaveC, waveAB, correctiveWave) =>
isWaveABC = false
foundMatch = false
if possibleWaveC
// search backwards and look for wave AB
for i=1 to 50
// Equity must be in correction else invalidated
if correctiveWave
if waveAB
foundMatch := true
break
//else
// keep looping
else
// motive wave invalidates search
foundMatch := false
break
// Did we match a waveAB with C?
if foundMatch
isWaveABC := true
else
isWaveABC := false
else
isWaveABC := false
waveABC = findWaveABC(possibleWaveC, waveAB, correctiveWave)
// Wave ABCD
findWaveABCD(possibleWaveB, waveABC, correctiveWave) =>
isWaveABCD = false
foundMatch = false
if possibleWaveB
// search backwards and look for wave ABC
for i=1 to 50
// Equity must be in correction else invalidated
if correctiveWave
if waveABC
foundMatch := true
break
//else
// keep looping
else
// motive wave invalidates search
foundMatch := false
break
// Did we match a waveABC with D?
if foundMatch
isWaveABCD := true
else
isWaveABCD := false
else
isWaveABCD := false
waveABCD = findWaveABCD(possibleWaveB, waveABC, correctiveWave)
// Wave ABCDE
findWaveABCDE(possibleWaveC, waveABCD, correctiveWave) =>
isWaveABCDE = false
foundMatch = false
if possibleWaveC
// search backwards and look for another wave ABC in this correction
for i=1 to 50
// Equity must be in correction else invalidated
if correctiveWave
if waveABCD
foundMatch := true
break
//else
// keep looping
else
// motive wave invalidates search
foundMatch := false
break
// Did we match a waveABC with another waveABC?
if foundMatch
isWaveABCDE := true
else
isWaveABCDE := false
else
isWaveABCDE := false
waveABCDE = findWaveABCDE(possibleWaveC, waveABCD, correctiveWave)
// Wave ABCDEF
findWaveABCDEF(possibleWaveB, waveABCDE, correctiveWave) =>
isWaveABCDEF = false
foundMatch = false
if possibleWaveB
// search backwards and look for another wave ABC in this correction
for i=1 to 50
// Equity must be in correction else invalidated
if correctiveWave
if waveABCDE
foundMatch := true
break
//else
// keep looping
else
// motive wave invalidates search
foundMatch := false
break
// Did we match a waveABC with another waveABC?
if foundMatch
isWaveABCDEF := true
else
isWaveABCDEF := false
else
isWaveABCDEF := false
waveABCDEF = findWaveABCDEF(possibleWaveB, waveABCDE, correctiveWave)
// Wave ABCDEFG
findWaveABCDEFG(possibleWaveC, waveABCDEF, correctiveWave) =>
isWaveABCDEFG = false
foundMatch = false
if possibleWaveC
// search backwards and look for another wave ABC in this correction
for i=1 to 50
// Equity must be in correction else invalidated
if correctiveWave
if waveABCDEF
foundMatch := true
break
//else
// keep looping
else
// motive wave invalidates search
foundMatch := false
break
// Did we match a waveABC with another waveABC?
if foundMatch
isWaveABCDEFG := true
else
isWaveABCDEFG := false
else
isWaveABCDEFG := false
waveABCDEFG = findWaveABCDEFG(possibleWaveC, waveABCDEF, correctiveWave)
// Determine individual corrective waves
waveA = possibleWaveA and not(waveABC) and not(waveABCDE)
waveB = waveAB and not(waveABCD)
waveC = waveABC
waveD = waveABCD
waveE = waveABCDE
waveF = waveABCDEF
waveG = waveABCDEFG
//-----------------------------------------------------------------------------
// Plot key cRSI points
// plot(crsiCrossBelowHighband?crsi:na, title='cRSI cross below high band', color=color.red, linewidth=7, style=plot.style_circles)
// plot(crsiCrossAboveLowband?crsi:na, title='cRSI cross above low band', color=color.green, linewidth=7, style=plot.style_circles)
// plot(crsiCrossBelowWMA?crsi:na, title='cRSI cross below WMA', color=color.red, linewidth=5, style=plot.style_cross)
// plot(crsiCrossAboveWMA?crsi:na, title='cRSI cross above WMA', color=color.green, linewidth=5, style=plot.style_cross)
// plot(crsiCrossAbove50?crsi:na, title='cRSI cross above 50', color=color.black, linewidth=7, style=plot.style_circles)
// plot(crsiCrossBelow50?crsi:na, title='cRSI cross below 50', color=color.black, linewidth=7, style=plot.style_circles)
// plot(crsiTop?crsi[1]:na, title='cRSI Top', color=color.blue, linewidth=4, style=plot.style_cross, offset=-1)
// plot(crsiBottom?crsi[1]:na, title='cRSI Top', color=color.purple, linewidth=4, style=plot.style_cross, offset=-1)
//--------------------
// Impulse waves
plotStrong = input(title="Plot Strong Impulse Waves (above upper band)", defval=true) and plotCRSI
plotWeak = input(title="Plot Weak Impulse Waves (below upper band)", defval=true) and plotCRSI
impWaveSz = size.tiny
plotshape(plotStrong and waveStrongImpulse?crsi[1]:na, text="s", title='Strong Impulse', style=shape.labeldown, location=location.absolute, color=color.navy, transp=0, offset=-1, textcolor=color.white, size=impWaveSz)
plotshape(plotWeak and waveWeakImpulse?crsi[1]:na, text="w", title='Weak Impulse', style=shape.labeldown, location=location.absolute, color=color.purple, transp=0, offset=-1, textcolor=color.white, size=impWaveSz)
//---------------------
// Corrective waves
// plot(possibleWaveC?crsi[1]:na, title='Possible Wave C', color=color.green, linewidth=6, style=plot.style_circles, offset=-1)
// plot(possibleWaveB?crsi[1]:na, title='Possible Wave B', color=color.blue, linewidth=6, style=plot.style_circles, offset=-1)
// plot(possibleWaveA?crsi[1]:na, title='Possible Wave A', color=color.purple, linewidth=6, style=plot.style_circles, offset=-1)
// plot(waveAB?crsi[1]:na, title='Wave AB', color=color.black, linewidth=5, style=plot.style_cross, offset=-1)
// plot(waveABC?crsi[1]:na, title='Wave ABC', color=color.black, linewidth=7, style=plot.style_cross, offset=-1)
// plot(waveABCDE?crsi[1]:na, title='Wave ABCDE', color=color.black, linewidth=9, style=plot.style_cross, offset=-1)
// plotshape(waveAB?crsi[1]:na, title='Wave AB', style=shape.triangledown, location=location.absolute, color=color.orange, transp=0, offset=-1, text="AB", textcolor=color.orange, size=size.small)
// plotshape(waveABC?crsi[1]:na, title='Wave ABC', style=shape.triangleup, location=location.absolute, color=color.blue, transp=0, offset=-1, text="ABC", textcolor=color.blue, size=size.small)
// plotshape(waveABCD?crsi[1]:na, title='Wave ABCD', style=shape.triangledown, location=location.absolute, color=color.red, transp=0, offset=-1, text="ABCD", textcolor=color.red, size=size.small)
// plotshape(waveABCDE?crsi[1]:na, title='Wave ABCDE', style=shape.triangleup, location=location.absolute, color=color.green, transp=0, offset=-1, text="ABCDE", textcolor=color.green, size=size.small)
plotWaves = input(title="Plot Corrective Waves (ABC,ABCDE)", defval=true) and plotCRSI
corWaveSz = size.small
plotshape(plotWaves and waveA?crsi[1]:na, text="A", title='Wave A', style=shape.labelup, location=location.absolute, color=color.blue, transp=0, offset=-1, textcolor=color.white, size=corWaveSz)
plotshape(plotWaves and waveB?crsi[1]:na, text="B", title='Wave B', style=shape.labeldown, location=location.absolute, color=color.red, transp=0, offset=-1, textcolor=color.white, size=corWaveSz)
plotshape(plotWaves and waveC?crsi[1]:na, text="C", title='Wave C', style=shape.labelup, location=location.absolute, color=color.green, transp=0, offset=-1, textcolor=color.white, size=corWaveSz)
plotshape(plotWaves and waveD?crsi[1]:na, text="D", title='Wave D', style=shape.labeldown, location=location.absolute, color=color.maroon, transp=0, offset=-1, textcolor=color.white, size=corWaveSz)
plotshape(plotWaves and waveE?crsi[1]:na, text="E", title='Wave E', style=shape.labelup, location=location.absolute, color=color.lime, transp=0, offset=-1, textcolor=color.white, size=corWaveSz)
plotshape(plotWaves and waveF?crsi[1]:na, text="F", title='Wave F', style=shape.labeldown, location=location.absolute, color=color.fuchsia, transp=0, offset=-1, textcolor=color.white, size=corWaveSz)
plotshape(plotWaves and waveG?crsi[1]:na, text="G", title='Wave G', style=shape.labelup, location=location.absolute, color=color.aqua, transp=0, offset=-1, textcolor=color.white, size=corWaveSz)
//---------------------
// PRICE CHANGE BETWEEN IMPULSE AND WAVE A
//=================================================================================================================================
//=================================================================================================================================
// Divergence Indicator Using cRSI
//=================================================================================================================================
//=================================================================================================================================
plotBull = input(title="Plot Bullish (cRSI Higher-Low : Price Lower-Low)", defval=true) and plotCRSI
plotHiddenBull = input(title="Plot Hidden Bullish (cRSI Lower-Low : Price Higher-Low)", defval=true) and plotCRSI
plotBear = input(title="Plot Bearish (cRSI Lower-High : Price Higher-High", defval=true) and plotCRSI
plotHiddenBear = input(title="Plot Hidden Bearish (cRSI Higher-High : Price Lower-High)", defval=true) and plotCRSI
//------------------------------------------------------------------------------
crsiHighs = waveStrongImpulse or waveWeakImpulse
crsiLows = possibleWaveA or possibleWaveC
//------------------------------------------------------------------------------
// Regular Bullish --> cRSI makes a Higher-Low, but price makes a Lower-Low
// Hidden Bullish --> cRSI makes a Lower-Low, but price makes a Higher-Low
bullish(crsiLows, crsi, price) =>
foundLow = false
crsiHigherLow = false
priceHigher = false
regularBullish = false
hiddenBullish = false
if crsiLows[0] == true
for i=1 to 50
if crsiLows == true
foundLow := true
// crsi higher or lower?
if crsi[0] > crsi
crsiHigherLow := true
else
crsiHigherLow := false
// price higher or lower
if price[0] > price
priceHigher := true
else
priceHigher := false
// found low, stop looking
break
else
continue
if foundLow
// Regular Bullish --> cRSI makes a Higher-Low, but price makes a Lower-Low
if (crsiHigherLow==true) and (priceHigher==false)
regularBullish := true
hiddenBullish := false
// Hidden Bullish --> cRSI makes a Lower-Low, but price makes a Higher-Low
else if (crsiHigherLow==false) and (priceHigher==true)
regularBullish := false
hiddenBullish := true
else
regularBullish := false
hiddenBullish := false
else
regularBullish := false
hiddenBullish := false
else
// this is not a low
regularBullish := false
hiddenBullish := false
// return tuple
[regularBullish,hiddenBullish]
[regularBullish,hiddenBullish] = bullish(crsiLows, crsi, close)
plotshape(plotBull and regularBullish?crsi[1]-12:na, text="Bull", title='Bull', style=shape.labelup, location=location.absolute, color=color.green, transp=0, offset=-1, textcolor=color.white, size=corWaveSz)
plotshape(plotHiddenBull and hiddenBullish?crsi[1]-12:na, text="H Bull", title='Hidden Bull', style=shape.labelup, location=location.absolute, color=color.green, transp=20, offset=-1, textcolor=color.white, size=corWaveSz)
//------------------------------------------------------------------------------
// Regular Bearish --> cRSI makes a Lower-High, but price makes a Higher-High
// Hidden Bearish --> cRSI makes a Higher-High, but price makes a Lower-High
bearish(crsiHighs, crsi, price) =>
foundHigh = false
crsiHigherHigh = false
priceHigher = false
regularBearish = false
hiddenBearish = false
if crsiHighs[0] == true
for i=1 to 50
if crsiHighs == true
foundHigh := true
// crsi higher or lower?
if crsi[0] > crsi
crsiHigherHigh := true
else
crsiHigherHigh := false
// price higher or lower
if price[0] > price
priceHigher := true
else
priceHigher := false
// found high, stop looking
break
else
continue
if foundHigh
// Regular Bearish --> cRSI makes a Lower-High, but price makes a Higher-High
if (crsiHigherHigh==false) and (priceHigher==true)
regularBearish := true
hiddenBearish := false
// Hidden Bearish --> cRSI makes a Higher-High, but price makes a Lower-High
else if (crsiHigherHigh==true) and (priceHigher==false)
regularBearish := false
hiddenBearish := true
else
regularBearish := false
hiddenBearish := false
else
regularBearish := false
hiddenBearish := false
else
// this is not a low
regularBearish := false
hiddenBearish := false
// return tuple
[regularBearish,hiddenBearish]
[regularBearish,hiddenBearish] = bearish(crsiHighs, crsi, close)
plotshape(plotBear and regularBearish?crsi[1]+10:na, text="Bear", title='Bear', style=shape.labeldown, location=location.absolute, color=color.red, transp=0, offset=-1, textcolor=color.white, size=corWaveSz)
plotshape(plotHiddenBear and hiddenBearish?crsi[1]+10:na, text="H Bear", title='Hidden Bear', style=shape.labeldown, location=location.absolute, color=color.red, transp=20, offset=-1, textcolor=color.white, size=corWaveSz)
//==================================================================================================================================================================================================================================================================
//==================================================================================================================================================================================================================================================================
//==================================================================================================================================================================================================================================================================
// Buy/Sell Strategy
//==================================================================================================================================================================================================================================================================
//==================================================================================================================================================================================================================================================================
//==================================================================================================================================================================================================================================================================
// Remove duplicate buy/sells if one was already executed recently
filterLookback = 5
// normalize a value in a range between min and max
normalize(val, valMin, valMax) =>
valNorm = val
valNorm := valNorm < valMin ? valMin : valNorm
valNorm := valNorm > valMax ? valMax : valNorm
valNorm := (valNorm-valMin) / (valMax-valMin)
recentWave(wave, lookback) =>
ret = false
found = false
for i=0 to lookback
if wave == true
found := true
break
if found
ret := true
else
ret := false
//-----------------------------------------------------------------------------
// Levels for upper band - High
crsiHighband_extremeHighLevel = 90
crsiHighband_highLevel = 70
crsiHighband_highWeight = normalize(crsiHighband, crsiHighband_highLevel, crsiHighband_extremeHighLevel)
// Levels for upper band - Low
crsiHighband_extremeLowLevel = 45
crsiHighband_lowLevel = 55
crsiHighband_lowWeight = 1.0 - normalize(crsiHighband, crsiHighband_extremeLowLevel, crsiHighband_lowLevel)
// plot(crsiHighband_highWeight,color=color.blue)
// plot(crsiHighband_lowWeight,color=color.red)
//-----------------------------------------------------------------------------
// // Levels for lower band - High
crsiLowband_extremeHighLevel = 80
crsiLowband_highLevel = 60
crsiLowband_higheight = normalize(crsiLowband, crsiLowband_highLevel, crsiLowband_extremeHighLevel)
// Levels for lower band - Low
crsiLowband_extremeLowLevel = 20
crsiLowband_lowLevel = 45
crsiLowband_lowWeight = 1.0 - normalize(crsiLowband, crsiLowband_extremeLowLevel, crsiLowband_lowLevel)
// plot(crsiLowband_highWeight,color=color.blue)
// plot(crsiLowband_lowWeight,color=color.red)
//--------------------------------------------------------------------------------------------
// SELL
//--------------------------------------------------------------------------------------------
maxSellOrderSize = 10
crsiHighband_above_crsiHighband_highLevel = crsiHighband > crsiHighband_highLevel ? true : false
Sell1 = waveStrongImpulse
Sell2 = crsiAboveHighband and crsiFalling ? true : false // Above high band and now falling
Sell3 = crsiAboveHighband[1] and crsiFalling ? true : false // 1x previous was above high band and now falling (sometimes it can be off by a bar)
Sell4 = crsiAboveHighband[2] and crsiFalling ? true : false // 2x previous was above high band and now falling (sometimes it can be off by a bar)
//Sell = Sell1 //and crsiHighband_above_crsiHighband_highLevel
// Sell = Sell1 //and crsiHighband_above_crsiHighband_highLevel
// Sell = (Sell1 or Sell2) //and crsiHighband_above_crsiHighband_highLevel
// Sell = (Sell1 or Sell2 or Sell3) //and crsiHighband_above_crsiHighband_highLevel
Sell = (Sell1 or Sell2 or Sell3 or Sell4) and crsiHighband_above_crsiHighband_highLevel
Sell := filterSignal(Sell, filterLookback)
// Base sell size on how high the Highband is
sellSize = crsiHighband_highWeight *maxSellOrderSize // When in doubt, DON'T SELL! Stonks only go up ;)
// extreme cRSI
sellSize := crsi > crsiHighband_extremeHighLevel ? 1.5*maxSellOrderSize : sellSize
// if the sell size is small, just make min sell
sellSize := sellSize < maxSellOrderSize/3 ? 0 : sellSize
sellSize := round(sellSize)
if Sell
strategy.order("Sell", false, sellSize)
//--------------------------------------------------------------------------------------------
// BUY - Price can continue to fall even when cRSI is rising!!!
//--------------------------------------------------------------------------------------------
maxBuyOrderSize = 10
// Wait until it crosses back above WMA so it is clear that motive wave is clear.
// Buying at the bottom is really hard because RSI can start to rise yet price will continue to fall
Buy1 = bullStart
// Using waves can help do a better job timing the bottom, but big corrections can go much deeper than just Wave C (Zig Zag)
Buy2 = waveA and regularBullish
Buy3 = waveC and regularBullish
Buy4 = waveE and (topBottomLookback == 3) // usullay max is a wave E with topBottomLookback == 3
Buy5 = waveG and (topBottomLookback == 2) // can see a G wave when topBottomLookback == 2
Buy = Buy1 or Buy2 or Buy3 or Buy4 or Buy5
Buy := filterSignal(Buy, filterLookback)
// Base buy size on how low the Lowband is
buySize = crsiLowband_lowWeight*maxBuyOrderSize
// buySize := buySize < 1 ? 1 : buySize // When in doubt, BUY! Stonks only go up ;)
// Look for recent wave endings that can increase our guess of buying at a low
recentWaveC = recentWave(waveC, 10)
recentWaveE = recentWave(waveE, 10)
recentWaveG = recentWave(waveG, 10)
// buySize := recentWaveE ? 1.5*maxBuyOrderSize : buySize
// buySize := recentWaveG ? 1.5*maxBuyOrderSize : buySize
buySize := recentWaveE ? maxBuyOrderSize : buySize
buySize := recentWaveG ? maxBuyOrderSize : buySize
// if the buy size is small, just make min buy
buySize := buySize < maxSellOrderSize/3 ? 0 : buySize
buySize := round(buySize)
if Buy
strategy.order("Buy", true, buySize)