Custom OnBalanceVolume (OBV) Indicator for ThinkorSwim

BenTen

Administrative
Staff member
Staff
VIP
Lifetime
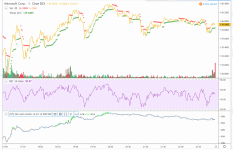
This indicator consists of the On Balance Volume (OBV) indicator along with two custom moving averages of the standard OBV. It was shared by Ken Rose (@KRose_TDA).

PGtvuv2.jpg


thinkScript Code

Code:
#Follow @KRose_TDA on twitter for updates to this and other scripts
#this script provides 2 moving averages of the study chosen
#default study in OnBalanceVolume Volume
declare lower;
#place the study desired after reference in the line below you must include the brackets "()"
#Initial study is OnBalanceVolume
plot MyStudy = reference OnBalanceVolume();
MyStudy.SetDefaultColor(GetColor(4));

input Moving_Averge_One_Length = 20;
input Moving_Averge_Two_Length = 50;
Input Line_Weight_MyStudy = 4;
Input Line_Weight_Moving_Average_One = 3;
Input Line_Weight_Moving_Average_Two = 3;
MyStudy.setlineWeight(Line_Weight_MyStudy);
plot MaOne = Average(mystudy, Moving_Averge_One_Length);
MaOne.SetDefaultColor(GetColor(6));
MaOne.setlineWeight(Line_Weight_Moving_Average_One);
Plot MaTwo = Average(mystudy, Moving_Averge_Two_Length);
MaTwo.SetDefaultColor(GetColor(8));
MaTwo.setlineWeight(Line_Weight_Moving_Average_Two);

Shareable Link

https://tos.mx/nLH4MUi

Before using this, be sure to watch the following video, so you get an understanding of how it works.

 

Join useThinkScript to post your question to a community of 21,000+ developers and traders.

@NEKSUS here you go - took a first pass, if anyone has any good ideas on how to use it, trade it or have a trading plan around it or enhancements please share.

uVSOg3r.png


Port:

JRxVlrF.png


Ruby:
#OBV ADL Combination Indicator
#[ST] obv adl combination v4
#https://www.tradingview.com/script/YQY0qdVr-ST-obv-adl-combination-v4/

#Original spacetrader
#1.0 2019.10.24 ported by diazlaz

#OBV takes difference between old close and new close and multiplies by volume without considering high and low.
#Accum/dist takes difference between close and high and low without considering previous close or open.
#This is attempt to combine both so relative motion between candles is detected and volume direction is assigned based relative to movement within a candle.
#+ and - depends if close is above previous close (+ if above, - if below)
#Maximum upward volume counts if close = high and previous close = low, this makes multiplier 1 and thus entire volume is counted upwards
#Maximum downward volume counts if close = low and previous close = high, this makes multiplier -1 and thus entire volume is counted downwards.
#Zero volume movement occurs when close = previous close.
#Half upward volume movement occurs if close-previous_close is half the range from high-low.

#Updates
#Open used instead of previous close due to issues with grabbing previous close on some charts. This seems more accurate for gaps without volume.
#Multiply by ohcl4 to get volume in bitcoin - this way volume is in terms of something more stable overtime

declare lower;

input averageType = AverageType.WILDERS;
input price = close;

input emalength = 24; #ema length
input rsilength = 14; #rsi length

input showobv = yes; #Show obv?
input showema = no; #Show ema?
input showrsi = no; #Show rsi of obv?
input showtopextremes = no; #show top extreme levels?
input showbottomextremes = no; #show bottom extreme levels?
input highlightbreakouts = yes; #highlight breakouts?
input toplookback = 500; #top extreme lookback?
input bottomlookback = 500; #bottom extreme lookback?

def obv_btc = (volume * (close - open)/(high-low) * hlc3);
def all_obvbtc = TotalSum(obv_btc);
def na = Double.NaN;

#HIGHS and LOWS
def highs = highest(all_obvbtc, toplookback);
def lows = lowest(all_obvbtc, bottomlookback);

#RSI
def NetChgAvg = MovingAverage(averageType, price - price[1], rsilength);
def TotChgAvg = MovingAverage(averageType, AbsValue(price - price[1]), rsilength);
def ChgRatio = if TotChgAvg != 0 then NetChgAvg / TotChgAvg else 0;
def RSI = 50 * (ChgRatio + 1);

#PLOTS
plot pOBV = all_obvbtc;
pOBV.SetHiding (!showobv);

plot pEMA = ExpAverage(all_obvbtc, emalength);
pEMA.SetHiding (!showema);

plot pRSI = if showrsi then RSI else na;
pRSI.SetHiding (!showrsi);

plot pHighs = highs;
pHighs.SetPaintingStrategy(paintingStrategy = PaintingStrategy.SQUARES);
pHighs.SetHiding (!showtopextremes);

plot pLows = lows;
pLows.SetPaintingStrategy(paintingStrategy = PaintingStrategy.SQUARES);
pLows.SetHiding (!showbottomextremes);

plot pHighlightBreakoutsHigh =  if highs>highs[1] then highs else na;
pHighlightBreakoutsHigh.SetPaintingStrategy(paintingStrategy = PaintingStrategy.SQUARES);
pHighlightBreakoutsHigh.AssignValueColor(COLOR.LIME);
pHighlightBreakoutsHigh.SetHiding (!highlightbreakouts);

plot pHighlightBreakoutsLows =  if lows<lows[1] then lows else na;
pHighlightBreakoutsLows.SetPaintingStrategy(paintingStrategy = PaintingStrategy.SQUARES);
pHighlightBreakoutsLows.AssignValueColor(COLOR.ORANGE);
pHighlightBreakoutsLows.SetHiding (!highlightbreakouts);

#end of OBV ADL Combination Indicator
 

Attachments

  • uVSOg3r.png
    uVSOg3r.png
    349.5 KB · Views: 153
  • JRxVlrF.png
    JRxVlrF.png
    171.3 KB · Views: 149
Last edited by a moderator:
I modeled this after playing around with MACD in thinkscript. This script calculates On Balance Volume and applies a fast and slow MA, takes the difference and plots a histogram. also has some lines that plot on the histogram edges that show divergence when price is going up and the OBV is going down and vice versa.

Code:
declare lower;

def NA = Double.NaN;
def POBVC = TotalSum(if close > close[1] then + volume else - volume);
def NOBVC = TotalSum(if close < close[1] then - volume else + volume);
plot WelkinOBVAvgVal = (POBVC + NOBVC) / 2;
#The below commented out plot essentially does the same as the above POBVC and NOBVC (positive and negative calculations and then averaged together), but I've found the above to provide better response signals. swap #'s to test.
#plot WelkinOBVAvgVal = Average(TotalSum(if close > close[1] then + volume else - volume));

WelkinOBVAvgVal.Hide();

input paintbars = no;
input AvgFastLength = 4;
input AvgSlowLength = 9;

def AvgF = Average(WelkinOBVAvgVal, "length" = AvgFastLength);
def AvgS = Average(WelkinOBVAvgVal, "length" = AvgSlowLength);


plot WelkinOBV = AvgF - AvgS;
plot ObvDivergeLine1 = if high < high[1] and WelkinOBV > WelkinOBV[1] then WelkinOBV else NA;
plot ObvDivergeLine2 = if low > low[1] and WelkinOBV < WelkinOBV[1] then WelkinOBV else NA;


plot zeroline = 0;

WelkinOBV.SetPaintingStrategy(PaintingStrategy.SQUARED_HISTOGRAM);

ObvDivergeLine1.SetLineWeight(4);
ObvDivergeLine2.SetLineWeight(4);

WelkinOBV.DefineColor("Positive and Up", Color.GREEN);
WelkinOBV.DefineColor("Positive and Down", Color.DARK_GREEN);
WelkinOBV.DefineColor("Negative and Down", Color.RED);
WelkinOBV.DefineColor("Negative and Up", Color.YELLOW);

WelkinOBV.AssignValueColor(if WelkinOBV >= 0 then if WelkinOBV > WelkinOBV[1] then WelkinOBV.Color("Positive and Up") else WelkinOBV.Color("Positive and Down") else if WelkinOBV < WelkinOBV[1] then WelkinOBV.Color("Negative and Down") else WelkinOBV.Color("Negative and Up"));

AssignPriceColor(if !paintbars then Color.CURRENT else if WelkinOBV >= 0 then if WelkinOBV > WelkinOBV[1] then color.GREEN else  color.DARK_GREEN else if WelkinOBV < WelkinOBV[1] then color.RED else  color.YELLOW);

ObvDivergeLine1.DefineColor("UpDiv", Color.BLUE);
ObvDivergeLine2.DefineColor("DownDiv", Color.DARK_ORANGE);
ObvDivergeLine1.DefineColor("Neutral", Color.GRAY);
ObvDivergeLine2.DefineColor("Neutral", Color.GRAY);

ObvDivergeLine1.AssignValueColor(if high < high[1] and WelkinOBV > WelkinOBV[1] then ObvDivergeLine1.Color("UpDiv") else ObvDivergeLine1.Color("Neutral"));

ObvDivergeLine2.AssignValueColor(if low > low[1] and WelkinOBV < WelkinOBV[1] then ObvDivergeLine2.Color("DownDiv") else ObvDivergeLine2.Color("Neutral"));

zeroline.SetLineWeight(2);

zeroline.SetDefaultColor(Color.GRAY);
https://tos.mx/6OSwy73
LspPc5O.png
 
Last edited:
@Welkin: Do you, by any chance, have this coded for a Thinkorswim Watchlist (reflecting the various colors of red, yellow and green)? I will have a look and know that others will also find value in your watchlist contribution. Stay safe and thrive! Mahalo!
 
Last edited by a moderator:
@Schminga Made a quick improvement. Save multiple custom quotes with the same code under a different name (obv0,obv1,obv2) etc... make sure the aggregations match(5 min, 30 min, daily or whatever) and edit the first line that says input lookback = 0 to 1,2,3,... for every custom quote you created.

Then it should display like this:

2DLRyn0.png


Make sure the columns are arranged in the correct lookback order..., 4, 3, 2, 1, 0

Code:
input lookback = 0;

def NA = Double.NaN;
def POBVC = TotalSum(if close > close[1] then + volume else - volume);
def NOBVC = TotalSum(if close < close[1] then - volume else + volume);
def WelkinOBVAvgVal = (POBVC + NOBVC) / 2;

input AvgFastLength = 4;
input AvgSlowLength = 9;

def AvgF = Average(WelkinOBVAvgVal, "length" = AvgFastLength);
def AvgS = Average(WelkinOBVAvgVal, "length" = AvgSlowLength);


def WelkinOBV = AvgF - AvgS;
def ObvDivergeLine1 = if high < high[1] and WelkinOBV > WelkinOBV[1] then WelkinOBV else NA;
def ObvDivergeLine2 = if low > low[1] and WelkinOBV < WelkinOBV[1] then WelkinOBV else NA;

def zeroline = 0;

AddLabel(1, " ", Color.BLACK );

AssignBackgroundColor(if WelkinOBV >= 0 then if WelkinOBV[lookback] > WelkinOBV[1+lookback] then Color.GREEN else Color.DARK_GREEN else if WelkinOBV[lookback] < WelkinOBV[1+lookback] then Color.RED else Color.YELLOW);

Link: https://tos.mx/RHrkYBc
 
Last edited:
Thank you. I liked the first version with the up and down arrows within the color (ie, ... WelkinOBV[1] then "^ "). Should the new version have the same up and down arrows?
 
Thank you. I liked the first version with the up and down arrows within the color (ie, ... WelkinOBV[1] then "^ "). Should the new version have the same up and down arrows?
on line 21 replace
Code:
AddLabel(1, " ", Color.BLACK );
with
Code:
AddLabel(1, if WelkinOBV >= 0 then if WelkinOBV[lookback] > WelkinOBV[1+lookback] then "^ " else "v " else if WelkinOBV[lookback] < WelkinOBV[1+lookback] then "v " else "^ ", Color.BLACK );
I've found that it takes a little longer for it to refresh if you use this.
the lime green and yellow are "^" white the dark green and red are "v", so as long as you understand that they really aren't necessary
 
@Welkin thanks for the watchlist, i tried adding it to my watchlist but i can only see 1 color, how can i be able to see the other time aggregations? :)
create multiple custom quotes and paste the script into each one:
0jnwXbZ.png

if you want to see different time aggregations, when you edit the scripts change the time aggregation as seen here at the top,
and change the lookback period from 0 ( current), to 1,2,3,4,.... etc for each custom quote if you wish to see what OBV Hist was plotting 1,2,3,4,... bars ago in multiple columns... or you can just leave them all on 0 for current bar, but change the aggregations on all of them and you can see what it is plotting for on multiple time frames for the current bar on those aggregations... its up to you on how you want it to show on your watchlist.
UgXL0DB.png


NODdMYj.png


also keep in mind to change the fast and slow length to match what you are using on the main script if you want the readings to match up to the OBV hist on your charts, by default the script in the main post is set at 4 and 9.
Q33iTsY.png
 
Last edited:
@Welkin thanks bro, i actually tried it as you said but when i see it on the chart the parameters aren't as accurate as i'd like them to be. Anyways I used your code for a watchlist but instead of the histogram i created a version with a normal OBV and Moving Averages :) you should check it out!! I just checked it out and works in a weird way? Sometimes the colors don't plot the right way in the watchlist

Code:
#OBV SMA
input lookback = 0;
def NA = Double.NaN;
def Data = close;
declare lower;

def OBV = TotalSum(Sign(close - close[1]) * volume);


#OBV Osc Moving Averages
input OBVMALength = 8;
input OBVAverageType = AverageType.SIMPLE;


# plot the OBV Moving Average
def OBVMA = MovingAverage(OBVAverageType, OBV, OBVMALength);
DEF pOBVMA = OBVMA;


AddLabel(1, " ", Color.BLACK );


AssignBackgroundColor (IF OBV > POBVMA or OBV crosses above POBVMA then Color.GREEN else color.RED);

AssignBackgroundColor (IF OBV < POBVMA or OBV crosses below POBVMA then Color.RED else color.GREEN);
 
Last edited:
@hectorgasm made some small changes, you only needed one assignbackgroundcolor function, should refresh/load a little faster, try this:

Code:
#OBV SMA
input lookback = 0;
def NA = Double.NaN;
def Data = close;
def OBV = TotalSum(Sign(close - close[1]) * volume);

#OBV Osc Moving Averages
input OBVMALength = 8;
input OBVAverageType = AverageType.SIMPLE;
# plot the OBV Moving Average

def OBVMA = MovingAverage(OBVAverageType, OBV, OBVMALength);

AddLabel(1, " ", Color.BLACK );

AssignBackgroundColor(IF OBV > OBVMA then Color.GREEN else color.RED);

and also script wise you weren't too far off from making your own obv histogram, simply a slow and fast moving average of the obv with the difference taken (FMA - SMA) and plotted as a histogram
 
Last edited:
Im having issues with plot upsignal and plot downsignal. This is a combination of OBV and MACD. I would like to get a signal only when OBV crosses abovesignal line and when MACD fast length crosses slow length. And a signal for the opposite direction as well. Can anyone help me out? thanks

Code:
declare lower;

input length = 7;
input signalLength = 10;
input averageType = AverageType.EXPONENTIAL;
input showBreakoutSignals = yes;
input fastLength = 12;
input slowLength = 26;
input MACDLength = 9;

def obv = reference OnBalanceVolume();

plot Value = MovingAverage(averageType, close, fastLength) - MovingAverage(averageType, close, slowLength);
plot Avg = MovingAverage(averageType, Value, MACDLength);
plot Diff = Value - Avg;
plot ZeroLine = 0;
plot OBVM = MovingAverage(averageType, obv, length);
plot Signal = MovingAverage(averageType, OBVM, signalLength);
plot UpSignal = if obvm crosses above signal and value is above avg then signal else Double.NaN;
plot DownSignal = if obvm crosses below signal and signal is below avg then signal else Double.NaN;

UpSignal.SetHiding(!showBreakoutSignals);
DownSignal.SetHiding(!showBreakoutSignals);

Signal.SetDefaultColor(GetColor(2));

OBVM.SetDefaultColor(GetColor(5));
OBVM.SetPaintingStrategy(PaintingStrategy.line);
OBVM.SetLineWeight(3);
OBVM.DefineColor("Positive and Up", Color.GREEN);
OBVM.DefineColor("Positive and Down", Color.DARK_GREEN);
OBVM.DefineColor("Negative and Down", Color.RED);
OBVM.DefineColor("Negative and Up", Color.DARK_RED);
OBVM.AssignValueColor(if OBVM >= 0 then if OBVM > OBVM[1] then OBVM.Color("Positive and Up") else OBVM.Color("Positive and Down") else if OBVM < OBVM[1] then OBVM.Color("Negative and Down") else OBVM.Color("Negative and Up"));
 
Hi All,

I made this OBV label as follows to show the DAY period OBV on a 1min chart as a label:

Nznxq8c.png


That OBV calculation is roughly correct, as the OBV for the DAY period. That is what appears right after loading the study.

However, several seconds later the label bizarrely changes to this value:

xTqdmal.png


I can't understand how this is happening. This is the code for the label:

Code:
def Vol = volume(period = "DAY");
def OBV = TotalSum(Sign(close(period = "DAY") - close(period = "DAY")[1]) * Vol);
addlabel (yes, "OBV: " + (OBV), if OBV > 30000000 then Color.LIME else CreateColor(120,120,200));

Any ideas how this can be fixed or why this is happening?

Is it possible it's happening due to after hours period trades being calculated into the daily OBV?

EDIT: This is really dumb but there were a few reasons I had so much trouble with this. It's working now with this code:

Code:
def agg = aggregationperiod.day;
def c = close(period = agg);
def v = volume(period = agg);

def OBV = TotalSum(Sign(c - c[1]) * v);

AddLabel(yes, OBV, color.white);

I was getting discrepancies because when looking at a DAY chart, the length is always at least 30 days. Although the OBV code as I see it above appears to just refer back to the previous day (c[1]), obviously longer length makes a difference because having the 1min chart set to a 2 day length was causing discrepancies. If I have the 1min chart set to a 30 day length the value will be correct.

The weird change of the value from being correct in the first screenshot to wrong a few seconds later, as shown in the second screenshot, must have been happening because using period=day may have initially been calculating back 30 days by default but then the calculation was after a few moments refreshing to reflect the chart length and thus changing.
 
Last edited:
I am not editing the thread title as "solved" yet because I'm left with a problem that I still hope that I can get help with. I use some studies that only work well if I keep my 1min chart length at 1 day. But I need the OBV calculation to use a length of 30 days in order to be accurate. Is there a way to modify this OBV formula so that a length of 30 days is used on the 1min chart with a length of only 1 day?

Code:
def agg = aggregationperiod.day;
def c = close(period = agg);
def v = volume(period = agg);

def OBV = TotalSum(Sign(c - c[1]) * v);

AddLabel(yes, OBV, color.white);

The TotalSum function according to the documentation (https://tlc.thinkorswim.com/center/reference/thinkScript/Functions/Math---Trig/TotalSum): "The example returns the total accumulated volume for the time frame of the current chart." So it doesn't accept a length parameter. So I am at a loss for how a length parameter could be added to the OBV formula.

EDIT: I believe this is solved now, I just had to replace TotalSum with Sum which accepts a length of 30:

Code:
def agg = aggregationperiod.day;
def c = close(period = agg);
def v = volume(period = agg);

def OBV = Sum((Sign(c - c[1]) * v),30);
                
addlabel (yes, "OBV: " + (OBV), if OBV > 30000000 then Color.LIME else CreateColor(120,120,200));

I have therefore edited the thread title to say solved.
 
Last edited:
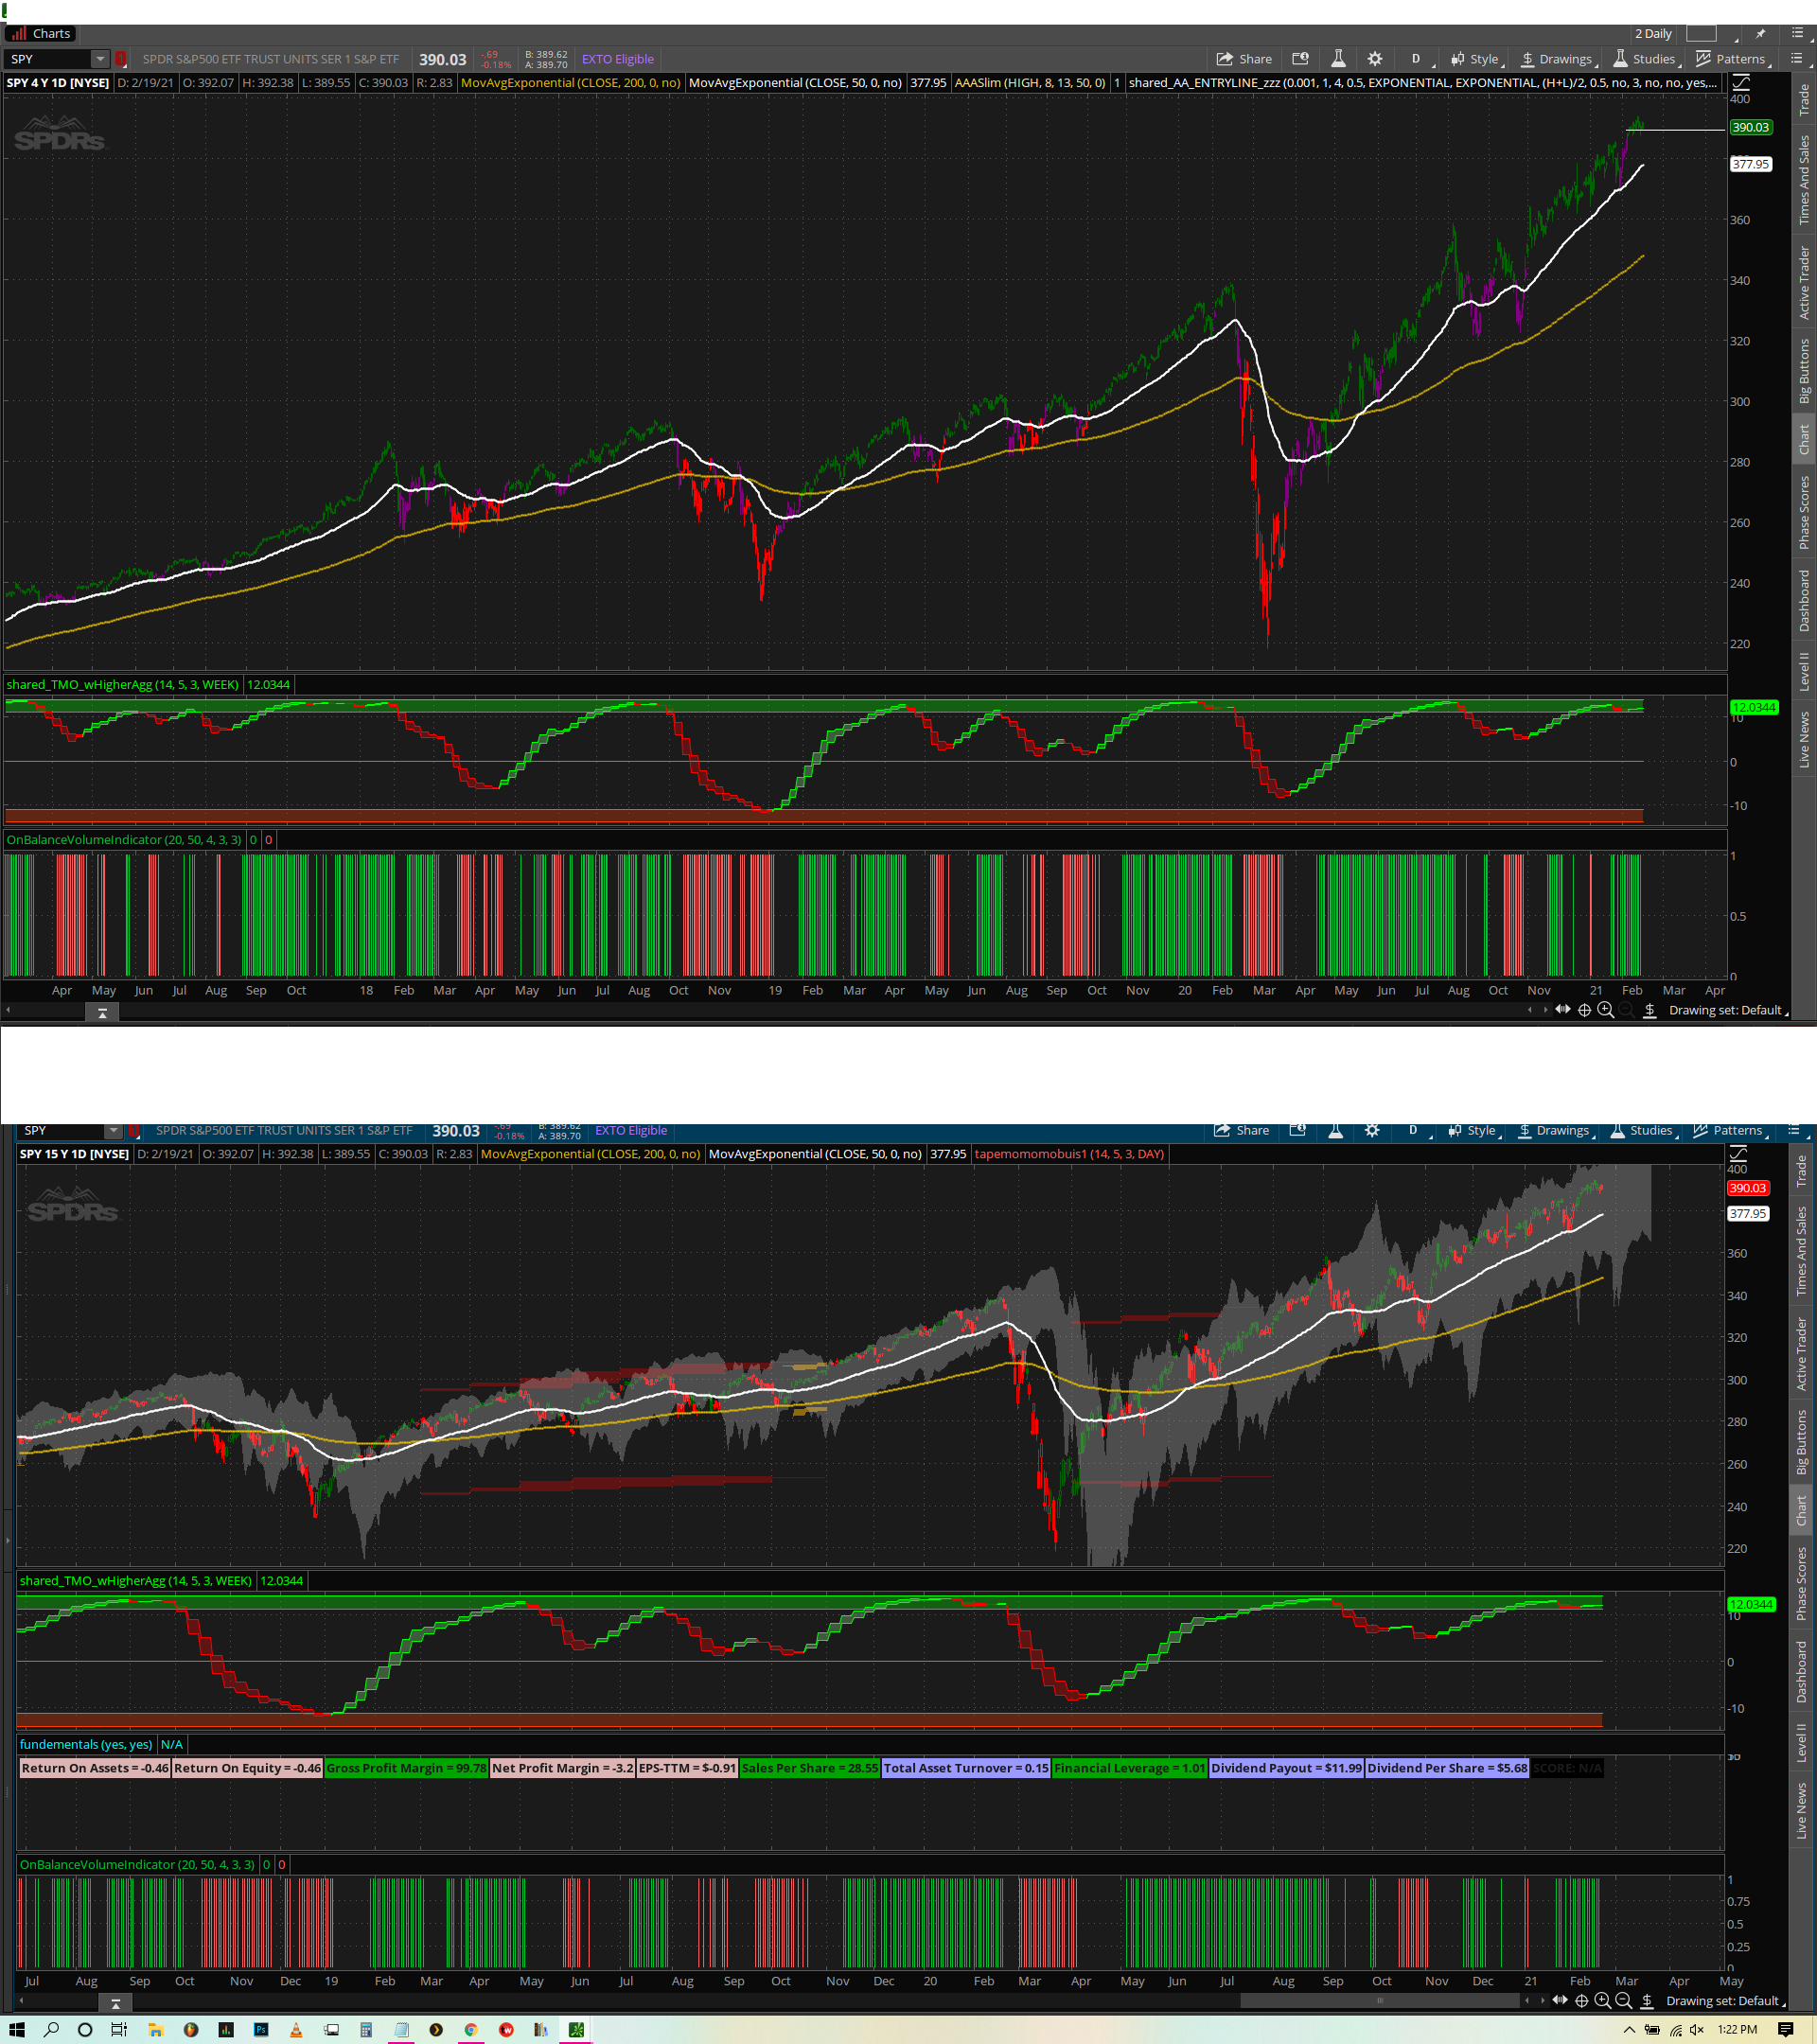
Hello everyone. This is an edit to the OBV indicator here. I have been lurking on these boards for a very long time but never had anything to share as I really just use the same indicators for a while now. I have enjoyed seeing what you all come up with though and playing around with them in my free time. So I figured I would drop this off here. This edit is more or less to help with a quick visual reference of what OBV is doing. One of it's down falls is that it won't tell you the deviation of the lines that one would get using the original indicator. Below is the indicator code isolated, a screen shot, as well as a total share of my set up.

K5RmjeE.png


Shared Work Space for those that want to check out everything
https://tos.mx/fWaqckW

What you will find:

Edited OBV as mentioned https://tos.mx/6mCU008
Edited Mobius TMO that paints the bars https://tos.mx/lXqV9WC
IV Cloud that plots the 30 day 1 standard deviation move based on derivatives pricing ( a reverse probability cone) https://tos.mx/MwEa6uX
50/200 EMA lines
A Fundamental indicator created by MerryDay which I think is fantastic and EVERYONE should be using Original- the best indicator on this forum! Very thankful!
A Cloud Squeeze Indicator that was found here that is also amazing Original

And a few other indicators hidden off screen that I happen to be playing around with.

If you have any questions please ask! Check out the workspace and you should get 2 charts one with an edited Ask Slim ribbons and one with TMO. I use both for confirmations. I am a swing trader and monthly options trade. Possible others can take something from my combination here. Thanks to everyone that posts here and I am really happy to finally be making my first post.


Code:
#Follow @KRose_TDA on twitter for updates to this and other scripts
#this script provides 2 moving averages of the study chosen
#default study in OnBalanceVolume Volume
declare lower;
#place the study desired after reference in the line below you must include the brackets "()"
#Initial study is OnBalanceVolume
def MyStudy = reference OnBalanceVolume();


input Moving_Averge_One_Length = 20;
input Moving_Averge_Two_Length = 50;
Input Line_Weight_MyStudy = 4;
Input Line_Weight_Moving_Average_One = 3;
Input Line_Weight_Moving_Average_Two = 3;

def MaOne = Average(mystudy, Moving_Averge_One_Length);

def MaTwo = Average(mystudy, Moving_Averge_Two_Length);

def A = mystudy > Maone and maone > matwo;

def B = matwo > Maone and maone > mystudy;


plot C = A;
plot D = B;

C.SetPaintingStrategy(PaintingStrategy.HISTOGRAM);
D.SetPaintingStrategy(PaintingStrategy.HISTOGRAM);
C.SetDefaultColor(getcolor(6));
D.SetDefaultColor(GetColor(5));
 
Last edited:
@young_and_dumb thank you for sharing this! I am so grateful and excited to play with your set up. I saved workspace and all components linked separately- but do not get 2 charts... I wonder if something is missing (2 charts one with an edited Ask Slim ribbons and one with TMO). My TMO lower is not looking like yours- its a smooth ribbon instead of squares like yours is above. Thank you for all help/links to set up. I do know how to add shared items and create new studies for pasted custom code...

The TMO is a smooth ribbon.
If you are asking about the very bottom indicator found in this image. THAT is the OBV. The script for it, appears directly below the image.
I have the ribbon but mine looks smooth and the one image above is blocky.. also, is there a way to indicate changes on obv (lightening of color or shprtening of the bars in lower obv indicator like how macd does,
 
@young_and_dumb thank you for sharing this! I am so grateful and excited to play with your set up. I saved workspace and all components linked separately- but do not get 2 charts... I wonder if something is missing (2 charts one with an edited Ask Slim ribbons and one with TMO). My TMO lower is not looking like yours- its a smooth ribbon instead of squares like yours is above. Thank you for all help/links to set up. I do know how to add shared items and create new studies for pasted custom code...


I have the ribbon but mine looks smooth and the one image above is blocky.. also, is there a way to indicate changes on obv (lightening of color or shprtening of the bars in lower obv indicator like how macd does,
MTF Indicators have a classical step shape because the study will flat line until it 'steps up' when the higher aggregation bar closes.
It is not possible for the ribbon to look smooth.
Please cut & paste the code from here again: https://usethinkscript.com/threads/...obv-indicator-for-thinkorswim.764/#post-53446
 
This indicator consists of the On Balance Volume (OBV) indicator along with two custom moving averages of the standard OBV. It was shared by Ken Rose (@KRose_TDA).

PGtvuv2.jpg


thinkScript Code

Code:
#Follow @KRose_TDA on twitter for updates to this and other scripts
#this script provides 2 moving averages of the study chosen
#default study in OnBalanceVolume Volume
declare lower;
#place the study desired after reference in the line below you must include the brackets "()"
#Initial study is OnBalanceVolume
plot MyStudy = reference OnBalanceVolume();
MyStudy.SetDefaultColor(GetColor(4));

input Moving_Averge_One_Length = 20;
input Moving_Averge_Two_Length = 50;
Input Line_Weight_MyStudy = 4;
Input Line_Weight_Moving_Average_One = 3;
Input Line_Weight_Moving_Average_Two = 3;
MyStudy.setlineWeight(Line_Weight_MyStudy);
plot MaOne = Average(mystudy, Moving_Averge_One_Length);
MaOne.SetDefaultColor(GetColor(6));
MaOne.setlineWeight(Line_Weight_Moving_Average_One);
Plot MaTwo = Average(mystudy, Moving_Averge_Two_Length);
MaTwo.SetDefaultColor(GetColor(8));
MaTwo.setlineWeight(Line_Weight_Moving_Average_Two);

Shareable Link

https://tos.mx/nLH4MUi

Before using this, be sure to watch the following video, so you get an understanding of how it works.


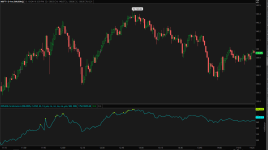
Hi, I just copied and paste this script but it doesn't display like the image above,
This indicator consists of the On Balance Volume (OBV) indicator along with two custom moving averages of the standard OBV. It was shared by Ken Rose (@KRose_TDA).

PGtvuv2.jpg


thinkScript Code

Code:
#Follow @KRose_TDA on twitter for updates to this and other scripts
#this script provides 2 moving averages of the study chosen
#default study in OnBalanceVolume Volume
declare lower;
#place the study desired after reference in the line below you must include the brackets "()"
#Initial study is OnBalanceVolume
plot MyStudy = reference OnBalanceVolume();
MyStudy.SetDefaultColor(GetColor(4));

input Moving_Averge_One_Length = 20;
input Moving_Averge_Two_Length = 50;
Input Line_Weight_MyStudy = 4;
Input Line_Weight_Moving_Average_One = 3;
Input Line_Weight_Moving_Average_Two = 3;
MyStudy.setlineWeight(Line_Weight_MyStudy);
plot MaOne = Average(mystudy, Moving_Averge_One_Length);
MaOne.SetDefaultColor(GetColor(6));
MaOne.setlineWeight(Line_Weight_Moving_Average_One);
Plot MaTwo = Average(mystudy, Moving_Averge_Two_Length);
MaTwo.SetDefaultColor(GetColor(8));
MaTwo.setlineWeight(Line_Weight_Moving_Average_Two);

Shareable Link

https://tos.mx/nLH4MUi

Before using this, be sure to watch the following video, so you get an understanding of how it works.


Hi BenTen, just joined, I like the OBV with MA above, can you please provide the complete script so I can try it out, thanks ; )
 

Similar threads

Not the exact question you're looking for?

Start a new thread and receive assistance from our community.

87k+ Posts
412 Online
Create Post

Similar threads

Similar threads

The Market Trading Game Changer

Join 2,500+ subscribers inside the useThinkScript VIP Membership Club
  • Exclusive indicators
  • Proven strategies & setups
  • Private Discord community
  • ‘Buy The Dip’ signal alerts
  • Exclusive members-only content
  • Add-ons and resources
  • 1 full year of unlimited support

Frequently Asked Questions

What is useThinkScript?

useThinkScript is the #1 community of stock market investors using indicators and other tools to power their trading strategies. Traders of all skill levels use our forums to learn about scripting and indicators, help each other, and discover new ways to gain an edge in the markets.

How do I get started?

We get it. Our forum can be intimidating, if not overwhelming. With thousands of topics, tens of thousands of posts, our community has created an incredibly deep knowledge base for stock traders. No one can ever exhaust every resource provided on our site.

If you are new, or just looking for guidance, here are some helpful links to get you started.

What are the benefits of VIP Membership?
VIP members get exclusive access to these proven and tested premium indicators: Buy the Dip, Advanced Market Moves 2.0, Take Profit, and Volatility Trading Range. In addition, VIP members get access to over 50 VIP-only custom indicators, add-ons, and strategies, private VIP-only forums, private Discord channel to discuss trades and strategies in real-time, customer support, trade alerts, and much more. Learn all about VIP membership here.
How can I access the premium indicators?
To access the premium indicators, which are plug and play ready, sign up for VIP membership here.
Back
Top