#cup_n_handle_03g
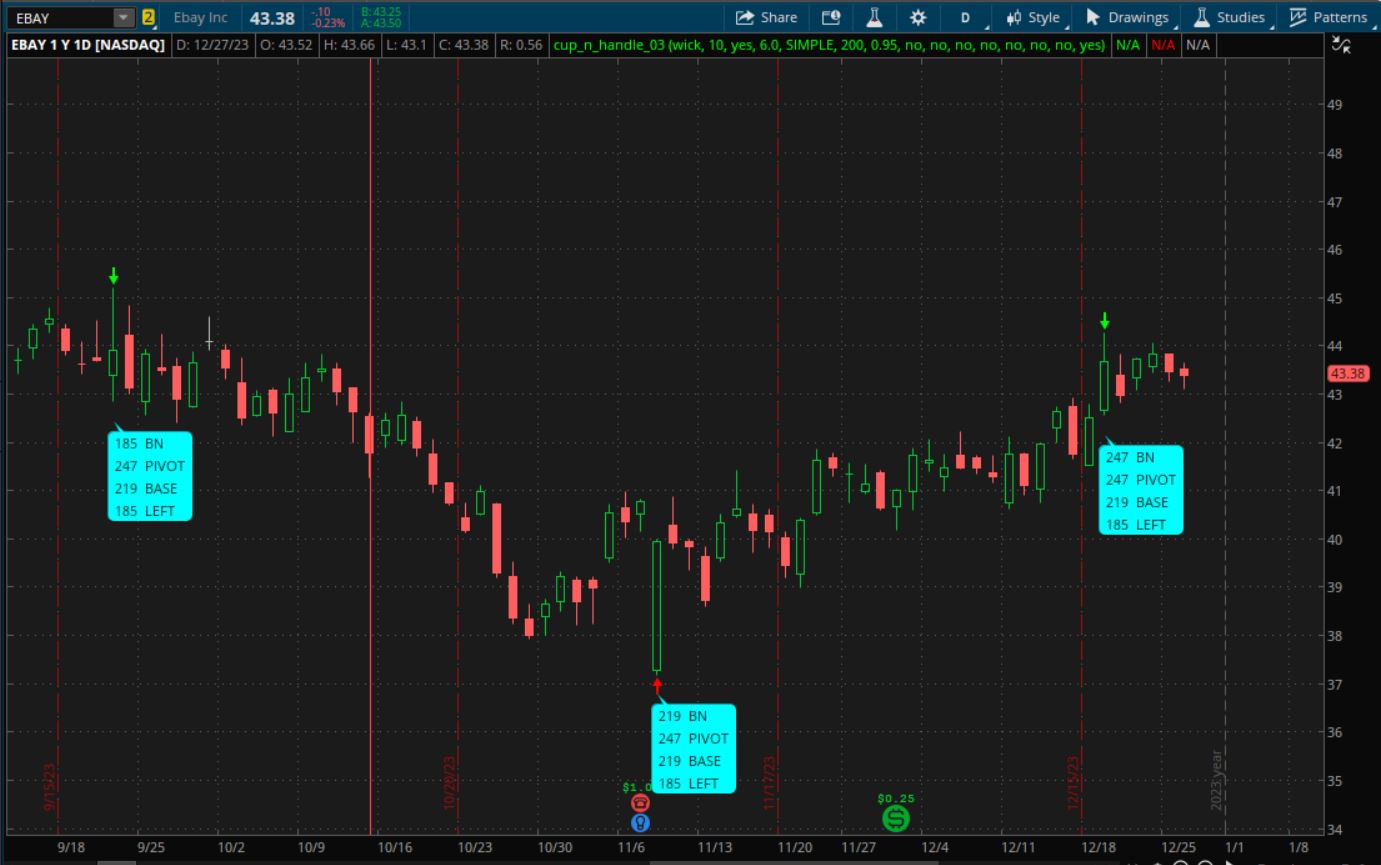
# test with EBAY day chart
#https://usethinkscript.com/threads/attempt-at-cup-and-handle-pattern.17536/#post-135874
#Attempt at Cup and Handle Pattern
#bulusufinances 12/24
# from current bar, look back for a cup-handle
# copy and rewrite rules from this site
# https://www.breakoutwatch.com/bootstrapAssets/html/cupandhandlepattern.html
# replace days , with bars
# r01 Current Close , close >= 6 and close >= ( 0.95 of ma200)
# r02 Pivot , Highest high , end of cup, beginning of the Handle. within last 90 bars
# r03 Pivot price % of Left Cup , Difference between the Left Cup and the Pivot, expressed as a percentage of the Left Cup. % <= +5% and % >= -40%
# r04 Left Cup , Highest high , beginning of the correction. >= 25 days and <=325 bars from the pivot
# r05 Cup length to Handle length Ratio , cup bars >= ( 3 x handle bars)
# r06 , Prior Low , lowest low before the cup left, price Rise from Prior Low to Left Cup >=30%
# r06b Setup Gain % The rise from the prior low to the left cup measured as a percentage of the prior low , >= 30%
# r07 Base Low Lowest low within the Cup.
# r08 Cup Depth price Difference between the Left Cup and Base Low, expressed as a percentage of the Left Cup. <=60%
# r09 Handle Depth Difference between the Pivot and the Handle Low, expressed as a percentage of the Pivot. <= 30%
# r10 Midpoint of Base Price which marks half the distance between the Left Cup and the Base Low. None
# r11 Midpoint of Handle Price which marks half the distance between the Pivot and the Handle Low. >= Midpoint of Base
#The stock must also meet these technical criteria to improve the chances of a successful breakout:
# r1b Current Close The price at which the stock closed today. >= $6
# r12 Average Volume The average daily volume over the last 50 days >=30,000
# r13 Relative Strength (RS)Rank The stock’s weighted price appreciation over the prior year, as ranked against all other stocks in our database. >=80
#---------------
#-----------------------
# copy the rules and add code
def na = double.nan;
def bn = barnumber();
def cls = close;
#def lastbar = (!isnan(close) and isnan(close[-1]));
def lastBar = HighestAll(if IsNaN(close) then 0 else bn);
#def lastbar = if l
def big = 99999;
# choose_wick_body01
input candle_levels = {default "wick" , "body" };
def highx;
def lowx;
switch (candle_levels) {
case "wick":
highx = high;
lowx = low;
case "body":
highx = max(open, close);
lowx = min(open, close);
}
#--------------------------
#https://usethinkscript.com/threads/zigzag-high-low-with-supply-demand-zones-for-thinkorswim.172/#post-7048
#post10 robert
# +------------------------------------------------------------+
# | Example: How to extend levels to the right of the chart |
# | Robert Payne |
# | https://funwiththinkscript.com |
# +------------------------------------------------------------+
# define peaks / valleys
#def na = double.nan;
#def bn = BarNumber();
input peak_length = 10;
#def lastBar = HighestAll(if IsNaN(close) then 0 else bn);
def offset = Min(peak_length - 1, lastBar - bn);
def peak = highx > Highest(highx[1], peak_length - 1) and highx == GetValue(Highest(highx, peak_length), -offset);
def valley = lowx < Lowest(lowx[1], peak_length - 1) and lowx == GetValue(Lowest(lowx, peak_length), -offset);
input peak_valley_arrows = yes;
plot zhi = if peak_valley_arrows and peak then high*1.001 else na;
plot zlo = if peak_valley_arrows and valley then low*0.999 else na;
zlo.SetPaintingStrategy(PaintingStrategy.ARROW_UP);
zlo.SetDefaultColor(Color.red);
zlo.setlineweight(1);
zlo.hidebubble();
zhi.SetPaintingStrategy(PaintingStrategy.ARROW_DOWN);
zhi.SetDefaultColor(Color.green);
zhi.setlineweight(1);
zhi.hidebubble();
#------------------------
#-------------------------------
# rules and code
# find offsets to signals, then calc barnumbers
# r01 Current Close , close >= 6 and close >= ( 0.95 of ma200)
input min_price = 6.0;
input avg1_type = AverageType.Simple;
input avg1_length = 200;
def avg1 = MovingAverage(avg1_type , cls , avg1_length );
input avg_factor = 0.95;
def r01 = (cls >= min_price) and (cls >= (avg_factor * avg1));
input show_average_line = no;
plot zavg1 = if show_average_line then avg1 else na;
# r02 Pivot , Highest high , end of cup, beginning of the Handle. within last 90 bars
# my added rule - pivot should be higher than current price
# offset to pivot bar , handle_len
def pivot_len = 90;
# pivot_off
def handle_len = fold a1 = 0 to pivot_len
with p1
while !getvalue(peak,a1)
do p1+1;
def pivot_bn = if handle_len == pivot_len then 0 else highestall(if isnan(close) then 0 else (bn - handle_len));
def pivot = getvalue(highx, (bn - pivot_bn));
input test_r2 = no;
addchartbubble(test_r2, low*0.998,
bn + " bn\n" +
handle_len + " pivoff\n" +
pivot_bn + " pivbn\n" +
pivot + " piv"
, color.white, no);
# move down and add conditions to this formula
def cancel = if (pivot_bn == 0 or 0) then 1 else 0;
addlabel(cancel, " cancel , no cup-handle found ", color.cyan);
# r03
# r04 Left Cup , Highest high , beginning of the correction. >= 25 days and <=325 bars from the pivot
def pivotleftoffmin = 25;
def pivotleftoffmax = 325;
def left_start = (handle_len + pivotleftoffmin);
#def leftlenmax = pivotleftoffmax - left_start;
def leftlenmax = (handle_len + pivotleftoffmax);
# find prev peak , left side of cup
def left_off = fold a2 = handle_len + 1 to (pivotleftoffmax + handle_len)
with p2 = handle_len+1
while !getvalue(peak,a2)
do p2+1;
def left_bn = if left_off == leftlenmax then 0 else highestall(if isnan(close) then 0 else (bn - (handle_len + left_off)));
def left = getvalue(highx, (bn - left_bn));
def cup_bars = pivot_bn - left_bn;
input test_r4 = no;
addchartbubble(test_r4, low*0.99,
bn + " bn\n" +
left_off + " leftoff\n" +
left_bn + " leftbn\n" +
left + " left\n" +
cup_bars + " cup"
, color.white, no);
# r03 Pivot price % of Left Cup , Difference between the Left Cup and the Pivot, expressed as a percentage of the Left Cup. % <= +5% and % >= -40%
def leftpivpermin = -40;
def leftpivpermax = 5.0;
def leftpivot_per = round(100*(left-pivot)/left,1);
def isleftper = leftpivot_per > leftpivpermin and leftpivot_per < leftpivpermax;
input test_r3 = no;
addchartbubble(test_r3, low*0.99,
bn + " bn\n" +
left + " lt\n" +
pivot + " piv\n" +
leftpivot_per + " %\n" +
isleftper + "\n"
, color.white, no);
# r05 Cup length to Handle length Ratio , cup bars >= ( 3 x handle bars)
def ratio_min = 3.0;
def cuphandleratio = cup_bars/handle_len;
def iscupratio = cuphandleratio >= ratio_min;
input test_r5 = no;
addchartbubble(test_r5, low*0.99,
bn + " bn\n" +
"cup len ratio\n" +
cuphandleratio + "\n" +
iscupratio + " is"
, color.white, no);
# r06 , Prior Low , lowest low before the cup left, price Rise from Prior Low to Left Cup >=30%
# r06b Setup Gain % The rise from the prior low to the left cup measured as a percentage of the prior low , >= 30%
# r07 Base Low Lowest low within the Cup.
# offset to base low, from pivot
#def base_off = GetMinValueOffset(lowx[handle_len], cup);
def base_min = fold a3 = handle_len to cup_bars + handle_len
with p3 = big
do min(p3,getvalue(lowx,a3));
def base_off = fold a4 = handle_len to cup_bars + handle_len
with p4
do if base_min == getvalue(lowx, a4) then a4 else p4;
def base_bn = highestall(if isnan(close) then 0 else (bn - (base_off+handle_len)));
def base = getvalue(lowx, (bn - base_bn));
input test_r7 = no;
addchartbubble(test_r7, low*0.99,
bn + " bn\n" +
base_off + " Basoff\n" +
base_bn + " Bbn"
, color.white, no);
# r08 Cup Depth price Difference between the Left Cup and Base Low, expressed as a percentage of the Left Cup. <=60%
# r09 Handle Depth Difference between the Pivot and the Handle Low, expressed as a percentage of the Pivot. <= 30%
# r10 Midpoint of Base Price which marks half the distance between the Left Cup and the Base Low. None
# r11 Midpoint of Handle Price which marks half the distance between the Pivot and the Handle Low. >= Midpoint of Base
#The stock must also meet these technical criteria to improve the chances of a successful breakout:
# r1b Current Close The price at which the stock closed today. >= $6
# r12 Average Volume The average daily volume over the last 50 days >=30,000
# r13 Relative Strength (RS)Rank The stock’s weighted price appreciation over the prior year, as ranked against all other stocks in our database. >=80
input test_bn = no;
addchartbubble(test_bn, low*0.99,
bn + " bn"
, color.white, no);
#def bubs = (pivot_bn == bn or left_bn == bn or base_bn == bn);
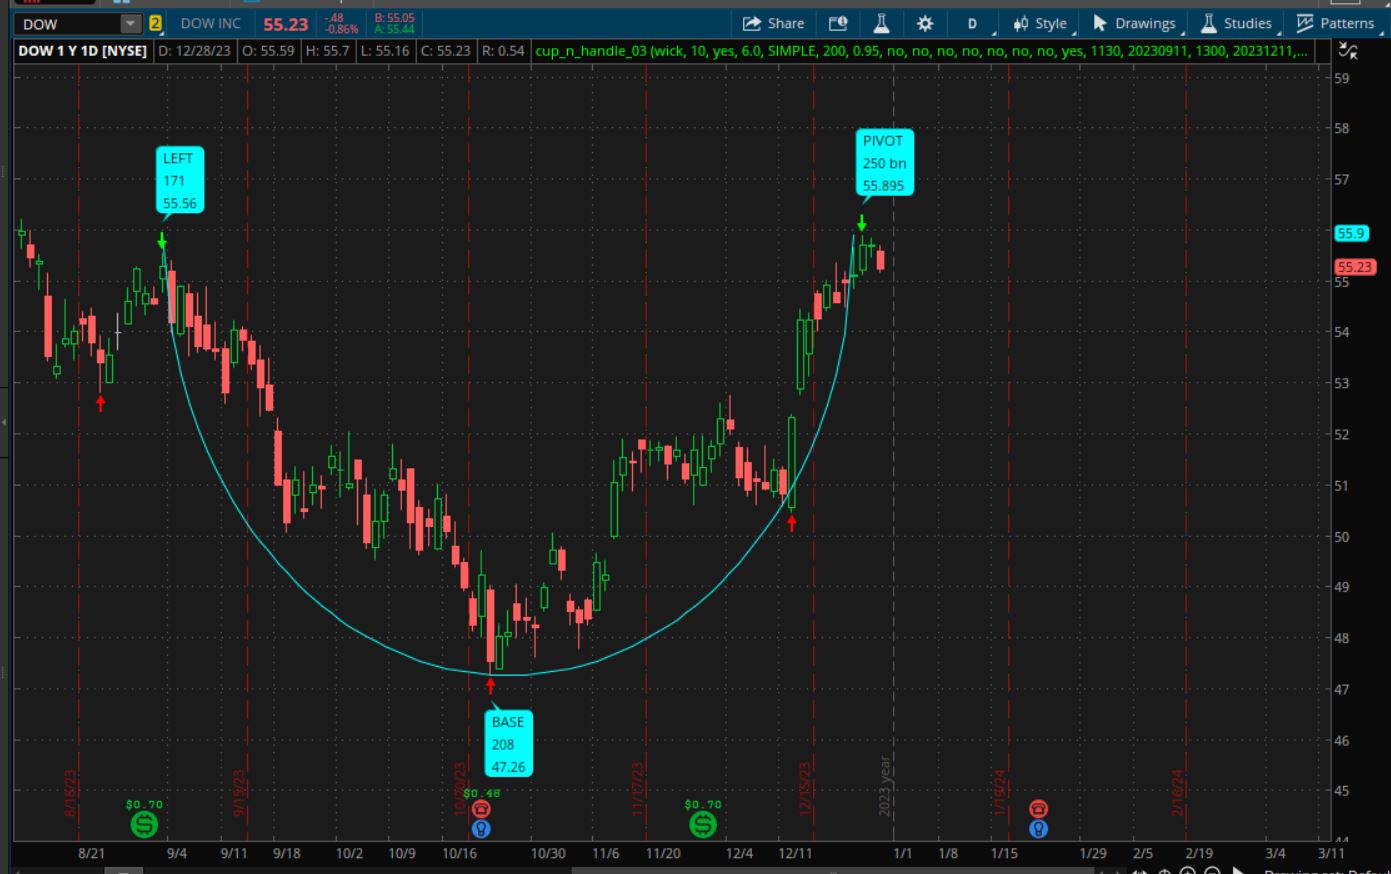
input test1_data = yes;
addchartbubble(test1_data and pivot_bn == bn, high*1.01,
# bn + " BN\n" +
"PIVOT\n" +
pivot_bn + " bn\n" +
pivot
, color.cyan, yes);
addchartbubble(test1_data and left_bn == bn, high*1.01,
# bn + " BN\n" +
"LEFT\n" +
left_bn + "\n" +
left
, color.cyan, yes);
addchartbubble(test1_data and base_bn == bn, low*0.99,
# bn + " BN\n" +
"BASE\n" +
base_bn + "\n" +
base
, color.cyan, no);
#///////////////////////////////////////////
#///////////////////////////////////////////
# circle
# circle_2points_0e
#https://usethinkscript.com/threads/experimental-draw-an-oval-circle-in-thinkorswim.11517/
#draw 2 ovals.
#define 2 points, by entering a date and time for each.
#draw a line connecting those points. this line will be the diameter and will be diagonal.
#calculate a horizontal diameter. (the oval will be wider than the 2 points)
#draw 2 arcs, for the top half and bottom half of the oval.
#this will be the outer oval.
#the center is marked with a yellow square.
#a 2nd smaller oval is drawn.
#it will have a width of the time span between the 2 points.
#the arc lines are not drawn on the date-time bars. (i don't remember why)
#i used different colors on the arcs, to show how they are drawn.
#i set the 2 dates as 5/20 and 5/31.
#set a chart to 30 days. mine is at 15min 30days
# circle_2points_0e
# https://usethinkscript.com/threads/drawing-a-circle-on-the-chart.10485/
# Drawing a Circle on the chart
#-------------------------------------------
#https://www.math.net/circle-formula
#Given that point (x, y) lies on a circle with radius r centered at the origin of the coordinate plane, it forms a right triangle with sides x and y, and hypotenuse r. This allows us to use the Pythagorean Theorem to find that the equation for this circle in standard form is:
#x^2 + y^2 = r^2
# adjusted radz - pythagorean
# r^2 = x^2 + y^2
# calc y
# y^2 = r^2 - x^2
# y = sqrt ( r^2 - x^2 )
#-------------------------------------------
#https://jshingler.github.io/TOS-and-Thinkscript-Snippet-Collection/TOS%20&%20Thinkscript%20Collection.html#c-draw-a-line-between-two-price-points
# jshingler web site
#C-DRAW A LINE BETWEEN TWO PRICE POINTS
#Hint: Draws a line between to points defined by dates, times and price type
#Developed by RCG3 and StanL on the ThinkScript Lounge 1/2/14
#-------------------------------------------
#def na = double.nan;
#def bn = barnumber();
def bn1_date = if bn == 1 then GetYYYYMMDD() else bn1_date[1];
input time1 = 1130; #hint time1: EST , Time of first point using the 24-hour clock
input date1 = 20230911; #hint date1:Date of the first point in YYYYMMDD format
input time2 = 1300; #hint time2: EST , Time of second point using the 24-hour clock
input date2 = 20231211; #hint date2: Date of the first point in YYYYMMDD format
input price = close; #hint price: Select the price type desired
def date1ok = (date1 < bn1_date);
input show_dates = no;
addlabel(show_dates and date1ok, "1st date is off the chart", (if date1ok then color.red else color.gray));
#addlabel(show_dates, "1st bar date " + bn1_date, color.yellow);
addlabel(show_dates, "1st date " + date1, color.yellow);
addlabel(show_dates, "2nd date " + date2, color.yellow);
def date= getyyyymmdd();
def x1= if secondsfromtime(time1) == 0 and date1==date then barnumber() else x1[1];
def y1= if secondsfromtime(time1) == 0 and date1==date then price else y1[1];
def x2= if secondsfromtime(time2) == 0 and date2==date then barnumber() else x2[1];
def y2= if secondsfromtime(time2) == 0 and date2==date then price else y2[1];
#def x11= highestall(x1);
#def y11= highestall(y1);
#def x22= highestall(x2);
#def y22= highestall(y2);
def cup_top = max(left, pivot);
def cup_ht = cup_top - base;
def x11 = left_bn;
def y11 = cup_top;
def x22 = pivot_bn;
def y22 = cup_top;
def slope= (y22-y11)/(x22-x11);
#plot line = if x1!=0 and x2[1]==0 then y1+((barnumber()-x1)*slope) else double.nan;
#line.setdefaultcolor(color.pink);
#def Angle_deg = ATan(slope) * 180 / Double.Pi;
#addLabel(yes, "Slope = " + Angle_deg + "degrees", color.CYAN);#Angle printout has no consistency at various aggs
#alert(price crosses line, "Price crossed trendline", alert.once,sound.chimes);# uncomment this line if used as a trendline
# ----------------------------------
# width of 2 points
def point_width = x22 - x11;
# horz width between 2 points
def point_width_half = floor(point_width/2);
# ----------------------------------
# height of 2 points
def maxy = max(y11, y22);
def miny = min(y11, y22);
def point_height = maxy - miny;
def point_height_half = round(point_height/2, 2);
# ----------------------------------
# center point of circle
def centerx = (x11 + point_width_half);
def centery = (miny + point_height_half);
# ----------------------------------
input test_arc_labels = no;
#addlabel(test_arc_labels, "bars |" + x1 + "|" + width + "|" + x22 , color.yellow);
#addlabel(test_arc_labels, "$$ |" + y1 + "|" + height + "|" + y22 , color.yellow);
addlabel(test_arc_labels, "bars " + x22 + " - " + x11 + " = " + point_width + " | 1/2 = " + (point_width/2), color.yellow);
addlabel(test_arc_labels, "$$ " + maxy + " - " + miny + " = " + point_height, color.yellow);
# ----------------------------------
# adjusted rad - pythagorean
#input height_factor = 13.0;
input height_factor = 1.0;
#def height0 = halfheight * height_factor;
def point_yfac = point_height_half * height_factor;
# use center x,y point and one x,y point, into pathagorean therum to calc hypot = radius
# horz rad , adjusted bar qty of a radius that spans the circle
def radz = floor(sqrt( point_width_half*point_width_half + point_yfac*point_yfac));
addlabel(test_arc_labels, "x " + point_width_half + " | y " + point_yfac, color.white);
addlabel(test_arc_labels, "adj rad, bars " + radz, color.white);
# ----------------------------------
#////////////////////////////////////////////
# the bars within the circle
#def circle_bars3 = if ( bn >= floor(x11 - radz) and bn <= floor(x22 + radz)) then 1 else 0;
def circle_bars3 = if ( bn >= floor(centerx - radz) and bn <= floor(centerx + radz)) then 1 else 0;
def barx3 = if !circle_bars3 then na else floor(absvalue(centerx - bn));
def arc_ht = sqrt(radz * radz);
input test4 = no;
addchartbubble(test4 and circle_bars3,low,
bn + "\n" +
x11 + " x1\n" +
x22 + " x2\n" +
circle_bars3 + "\n" +
centerx + " c\n" +
radz + " Rz\n" +
arc_ht + " Aht"
, (if circle_bars3 then color.yellow else color.gray),no);
# y = sqrt ( r^2 - x^2 )
#def y = sqrt( radz*radz -
def circle_y3 = if !circle_bars3 then na else sqrt( (radz * radz) - (barx3 * barx3) );
#def facy = cup_ht / (centery - circle_y3);
# ratio of arc ht to cup ht. to scale the arc
def facy = cup_ht / arc_ht;
addchartbubble(0 and circle_bars3, low, facy, color.white, no);
#input yfactor3 = .08;
#input yfactor3 = .2;
#input yfactor = .04;
def yfactor3 = facy;
#plot ytop3 = centery + (circle_y3 * yfactor3);
plot ybot3 = centery - (circle_y3 * yfactor3);
#ytop3.SetDefaultColor(Color.cyan);
ybot3.SetDefaultColor(Color.cyan);
# ----------------------------------
input rad_factor = 0.5;
#input y_factor = 0.5;
def rad_fac_num = floor(x11*rad_factor);
def bnsmall = x11 - rad_fac_num;
def bnbig = x22 + rad_fac_num;
# ---------------------
# pythag radz
#def bnsmall = x11 - rad_fac_num;
#def bnbig = x22 + rad_fac_num;
# ----------------------
addlabel(0, "small bns " + bnsmall + " " + x11, color.cyan);
addlabel(0, "big bns " + x22 + " " + bnbig, color.cyan);
#def circle_bars = if ( bn >= x11 and bn <= x22) then 1 else 0;
def circle_bars = if ( bn >= floor(x11*(1-rad_factor)) and bn <= floor(x22*(1+rad_factor))) then 1 else 0;
# -----------------------------------------
# def y = (pt1price + pt2price ) / 2;
#calc x and y center
#calc
#calc y
# y^2 = r^2 - x^2
# y = sqrt ( r^2 - x^2 )
# radius bars
def rad1 = centerx - x11;
#def rad2 = floor((x11 + x22)/2);
#addlabel(1, "rad0 " + rad0, color.yellow);
addlabel(test_arc_labels, "point_x " + point_width_half, color.yellow);
addlabel(test_arc_labels, "rad1 " + rad1, color.cyan);
#addlabel(1, "rad2 " + rad2, color.cyan);
# 2 pt height diff used to make factor ??
#input rad_factor = 1.0;
# if bars >= circle bars <= , centerx - bn
def barx = if !circle_bars then na else floor(absvalue(centerx - bn)*rad_factor);
#def radx = rad0 * rad_factor;
def radx = point_width_half * rad_factor;
# y = sqrt ( r^2 - x^2 )
# circle_bars
#def circley = if !circle_bars then na else sqrt( (rad0 * rad0) - (barx * barx) );
def circley = if !circle_bars then na else sqrt( (radx * radx) - (barx * barx) );
#input yfactor = .08;
#input yfactor = .04;
#plot ytop = centery + (circley * yfactor);
#plot ybot = centery - (circley * yfactor);
#ytop.SetDefaultColor(Color.magenta);
#ybot.SetDefaultColor(Color.violet);
addlabel(test_arc_labels, "center x " + centerx, color.yellow);
addlabel(test_arc_labels, "center y " + centery, color.yellow);
# center point
input show_arc_center = no;
plot ctr = if show_arc_center and bn == centerx then centery else na;
ctr.SetPaintingStrategy(PaintingStrategy.SQUARES);
ctr.SetDefaultColor(Color.yellow);
ctr.setlineweight(4);
#ctr.hidebubble();
# --------------------------------
# test codes
input test2 = no;
addchartbubble(test2, low,
bn + "\n" +
centerx + "\n" +
centery
, ( if ( bn == centerx) then color.yellow else color.gray), no);
input test1 = no;
addchartbubble(test1, low,
x1 + "\n" +
y1 + "\n" +
x2 + "\n" +
y2 + "\n" +
x22 + "\n" +
y22 + "\n" +
slope
, color.yellow, no);
#-------------------------------------------
# ref codes
#from tos chat - mobius
def data = getYYYYMMDD();
def year = Round(data/10000, 0);
def month = Round((data % 10000) / 100, 0);
def day = (data % 100);
#addLabel(1, "date: " + month + "/" + day + "/" + AsPrice(year), color.white);
#
#AMZN 15min 5/2022
#//////////////////////////////////////
#


")