ATR Expected Move Indicator For ThinkOrSwim

jonshank62

New member
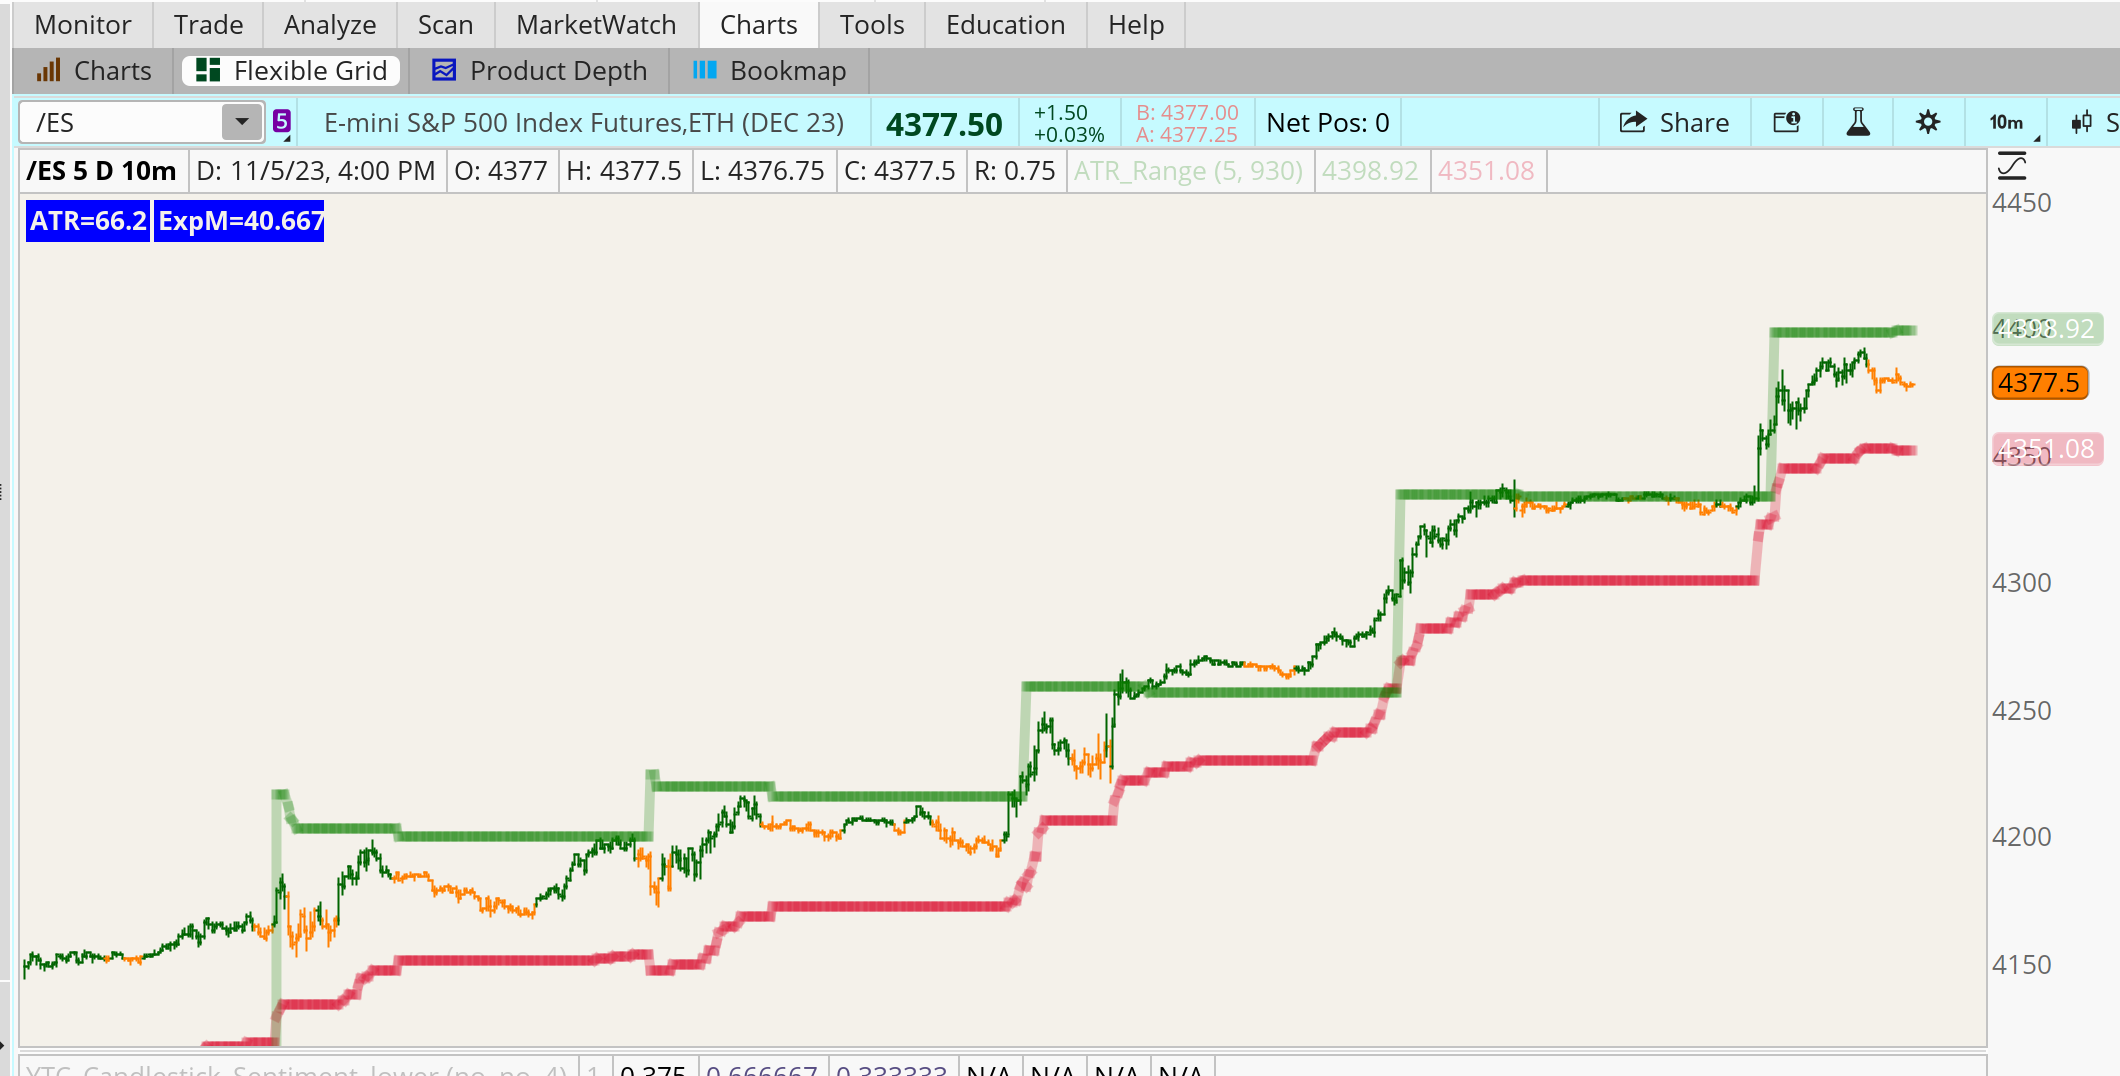
I use this code to help determine a stocks daily move and find it very accurate.
It is most accurate when used in the context of a stocks move from high to low
or vice versa not necessarily from the open.
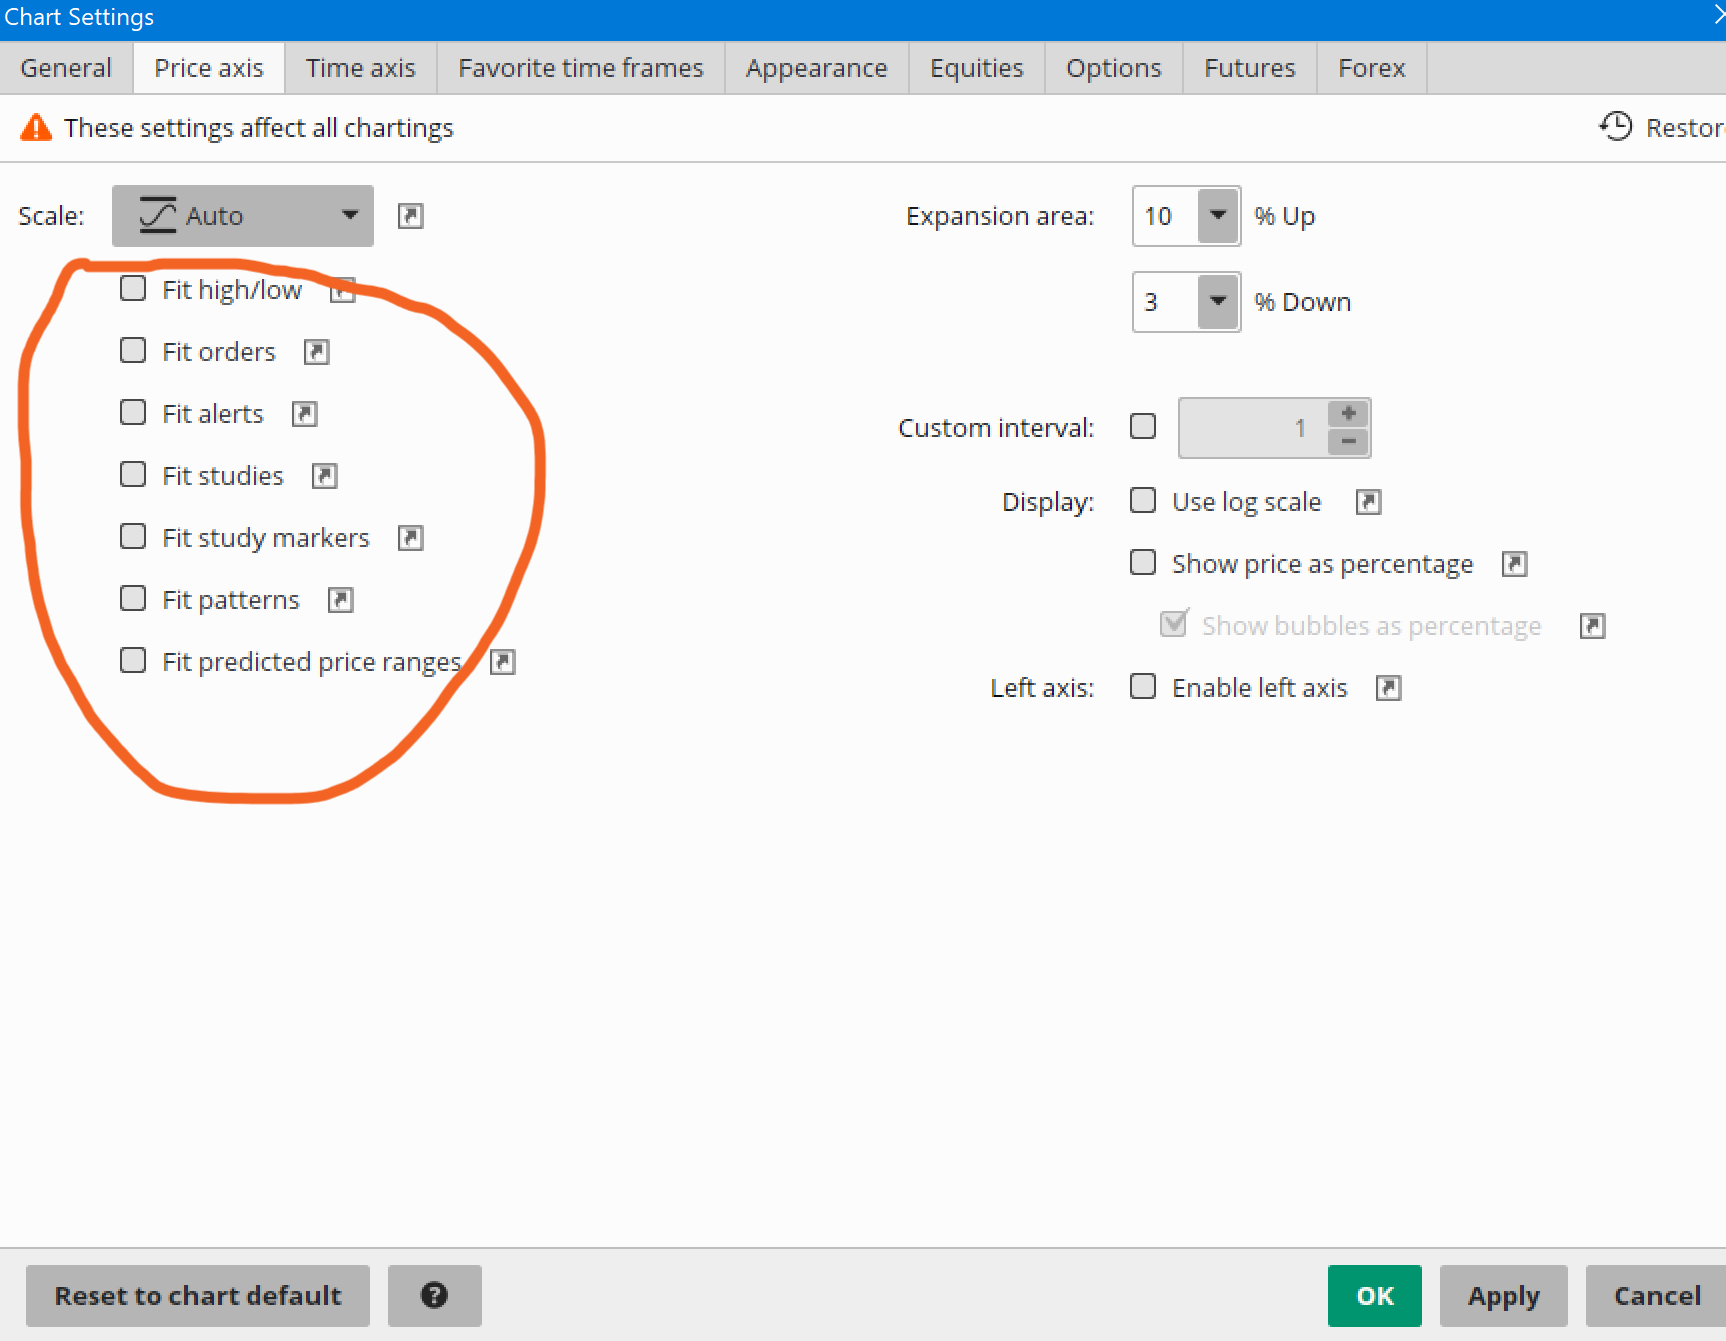
Is their a good way to turn this into a study ?.


input ATRLength = 5;
def ATR = Round(AvgTrueRange(high, close, low, ATRLength), 2);
def iv = Round(close() * (imp_Volatility()/15.87), 3);
addLabel(yes,concat("ATR=", ATR), color.Blue);
addLabel(yes,concat("ExpM=", iv), color.Blue);
 

Join useThinkScript to post your question to a community of 21,000+ developers and traders.

So if I took a good guess, this is what I have come up with:
The ATR and iv are based on daily prices.
The upper and lower bounds are determined by intraday highs and lows, with the upper bound being the low of the day + the iv and the lower bound being the high of the day - the iv. This makes a very interesting plot.

Code:
input ATRLength = 5;

input start_time = 0930;

def h = high(period = AggregationPeriod.DAY);
def l = low(period = AggregationPeriod.DAY);
def c = close(period = AggregationPeriod.DAY);

def ATR = Round(Average(TrueRange(h,  c,  l),  ATRLength), 2);
def iv = Round(c * (imp_volatility(period = AggregationPeriod.DAY) / 15.87), 3);
AddLabel(yes, Concat("ATR=", ATR), Color.BLUE);
AddLabel(yes, Concat("ExpM=", iv), Color.BLUE);

def Start = if secondsFromTime(start_time) >= 0 and secondsFromTime(start_time)[1] < 0 then 1 else 0;
def dayHigh = if start == 1 then high else if high > dayHigh[1] then high else dayHigh[1];
def dayLow = if start == 1 then low else if low < dayLow[1] then low else dayLow[1];

plot upperbound = dayLow + iv;
plot lowerbound = dayHigh - iv;

very interesting idea. seems to track fairly well at least on /ES and /CL

-mashume

UNoRcW6.png

Looks good but is their a way to not plot the zero line bottom of chart it shrinks the chart makes it hard to see
 
This is one of my new favorite indicators!
But depending on the instrument, you can experience some extreme plots.
Which, as you have seen, can mess up your chart if you have certain settings turned on.

In answer to your question:
There is no zero line.
BUT the expected move lines can experience extreme plots.

In order for your chart to not be squished due to these extremes, you need to turn off the following settings:
1. click on the gear next to the flask at the top of the chart.
2. click on price axis tab
3. unclick any / all boxes on the left-hand side that say 'fit'
umQWv03.png

Hope This Helps
 
Last edited:
So if I took a good guess, this is what I have come up with:
The ATR and iv are based on daily prices.
The upper and lower bounds are determined by intraday highs and lows, with the upper bound being the low of the day + the iv and the lower bound being the high of the day - the iv. This makes a very interesting plot.

Code:
input ATRLength = 5;

input start_time = 0930;

def h = high(period = AggregationPeriod.DAY);
def l = low(period = AggregationPeriod.DAY);
def c = close(period = AggregationPeriod.DAY);

def ATR = Round(Average(TrueRange(h,  c,  l),  ATRLength), 2);
def iv = Round(c * (imp_volatility(period = AggregationPeriod.DAY) / 15.87), 3);
AddLabel(yes, Concat("ATR=", ATR), Color.BLUE);
AddLabel(yes, Concat("ExpM=", iv), Color.BLUE);

def Start = if secondsFromTime(start_time) >= 0 and secondsFromTime(start_time)[1] < 0 then 1 else 0;
def dayHigh = if start == 1 then high else if high > dayHigh[1] then high else dayHigh[1];
def dayLow = if start == 1 then low else if low < dayLow[1] then low else dayLow[1];

plot upperbound = dayLow + iv;
plot lowerbound = dayHigh - iv;

very interesting idea. seems to track fairly well at least on /ES and /CL

-mashume

UNoRcW6.png
Resembles Mobius scriptlet...
I use it as a chop indicator.

input FractalCalculationsLength = 13; #hint FractalCalculationsLength: Periods or Length for the fractal calculations
input Periods_for_the_Smoothed_Signal_Line = 5; #hint Periods_for_the_Smoothed_Signal_Line: Periods for the Smoothed Signal Line.

def IV = if IsNaN(imp_volatility(period = AggregationPeriod.DAY))
then IV[1]
else imp_volatility(period = AggregationPeriod.DAY);
def HTH = Highest(Max(high, close[1]), FractalCalculationsLength);
def LTL = Lowest(Min(low, close[1]), FractalCalculationsLength);
def CIb = (((close * IV) / (HTH - LTL)) / Log(10));
def CI = WildersAverage(CIb, Periods_for_the_Smoothed_Signal_Line);

AddLabel(ShowLabels , if CI < CI[1] then "Trending" else "Choppy", if CI < CI[1] then Color.GREEN else Color.RED);


This is interesting but getting an error on the last line of code saying "showlabels" doesn't exist ?
 

Similar threads

Not the exact question you're looking for?

Start a new thread and receive assistance from our community.

87k+ Posts
266 Online
Create Post

Similar threads

Similar threads

The Market Trading Game Changer

Join 2,500+ subscribers inside the useThinkScript VIP Membership Club
  • Exclusive indicators
  • Proven strategies & setups
  • Private Discord community
  • ‘Buy The Dip’ signal alerts
  • Exclusive members-only content
  • Add-ons and resources
  • 1 full year of unlimited support

Frequently Asked Questions

What is useThinkScript?

useThinkScript is the #1 community of stock market investors using indicators and other tools to power their trading strategies. Traders of all skill levels use our forums to learn about scripting and indicators, help each other, and discover new ways to gain an edge in the markets.

How do I get started?

We get it. Our forum can be intimidating, if not overwhelming. With thousands of topics, tens of thousands of posts, our community has created an incredibly deep knowledge base for stock traders. No one can ever exhaust every resource provided on our site.

If you are new, or just looking for guidance, here are some helpful links to get you started.

What are the benefits of VIP Membership?
VIP members get exclusive access to these proven and tested premium indicators: Buy the Dip, Advanced Market Moves 2.0, Take Profit, and Volatility Trading Range. In addition, VIP members get access to over 50 VIP-only custom indicators, add-ons, and strategies, private VIP-only forums, private Discord channel to discuss trades and strategies in real-time, customer support, trade alerts, and much more. Learn all about VIP membership here.
How can I access the premium indicators?
To access the premium indicators, which are plug and play ready, sign up for VIP membership here.
Back
Top