
You are using an out of date browser. It may not display this or other websites correctly.
You should upgrade or use an alternative browser.
You should upgrade or use an alternative browser.
All Buy / Sell Volume Pressure Indicators & Labels For ThinkOrSwim
- Thread starter MerryDay
- Start date
-
- Tags
- buysellpressure volume
Join useThinkScript to post your question to a community of 21,000+ developers and traders.
I tweaked some basic code from an old RCB enhanced volume study that I've had for a while. I layer two of these volume studies on the chart, one showing any volume that hits 3 SD's and another showing 1 standard deviation (below). In addition to the volume bars changing colors based on the study, I'd like to have the price candles repaint to match the volume bars. Any help would be awesome! Cheers
https://usethinkscript.com/threads/thinkorswim-indicators-for-basic-fundamental-analysis.866/
#Chris' Enhanced Volume
###############
# Body
###############
input Audible_Alert = yes;
def Deviation_Length = 60;
def Deviate = 1;
def volumestdev = RelativeVolumeStDev(length = Deviation_Length);
def abovedev = volumestdev >= Deviate;
def belowdev = volumestdev <= Deviate;
###############
# Volume Bars
###############
plot volumereplace = volume;
volumereplace.SetPaintingStrategy(paintingStrategy = PaintingStrategy.HISTOGRAM);
def increase = volume > volume[1];
def devincrease = increase and abovedev;
def decrease = volume < volume[1];
def devdecrease = decrease and abovedev;
volumereplace.DefineColor("Increase", Color.DARK_GREEN);
volumereplace.DefineColor("DevIncrease", Color.GREEN);
volumereplace.DefineColor("Decrease", Color.DARK_RED);
volumereplace.DefineColor("DevDecrease", Color.LIGHT_RED);
volumereplace.AssignValueColor(
if devincrease then volumereplace.Color("DevIncrease")
else
if increase then volumereplace.Color("Increase")
else
if devdecrease then volumereplace.Color("DevDecrease")
else
volumereplace.Color("Decrease"));
Last edited by a moderator:
Michael_Oxlong
New member
I don't know that these are very accurate actually, If you derive Selling volume from Total volume and selling volume does not change but buying goes up you will see the selling volume number decrease. Volume never decreases in total number, it should only go up throughout the day based on the number of buys and sells.
I don't know that these are very accurate actually, If you derive Selling volume from Total volume and selling volume does not change but buying goes up you will see the selling volume number decrease. Volume never decreases in total number, it should only go up throughout the day based on the number of buys and sells.
Ruby:
def buying = V*(C-L)/(H-L);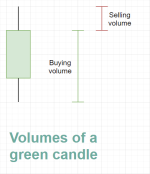
def selling = V*(H-C)/(H-L);The scripts discussed here are representative of the upticks and downticks of PRICE on the trading chart not volume.
We create a percentage for buying and selling pressure by using the candlestick pattern.
When we discuss Volume. We are discussing the size of the candle.
We then apply these percentages to the volume bars in an attempt to define momentum not actual buyers and sellers.
Attachments
Last edited:
Try thisI have been testing this one as well on TV and i like it, i think it would be useful to have on TOS so i hope someone can give the conversion a try.
Code:
#Heikan Ashi formula candles using CDV Trading View study:
#zoyd 05/22
#Addchart does not plot when extended hours are shown

declare lower;
def tw = high - Max(open, close);
def bw = Min(open, close) - low;
def body = AbsValue(close - open);

def v = volume;
def deltaup = if (open <= close) then v * 0.5 * (tw + bw + 2 * body) / (tw + bw + body) else v * 0.5 * (tw + bw) / (tw + bw + body);
def deltadown = if (open > close) then v * 0.5 * (tw + bw + 2 * body) / (tw + bw + body) else v * 0.5 * (tw + bw) / (tw + bw + body);
def delta = if (close >= open) then deltaup else -1 * deltadown;
def cumdelta = TotalSum(delta);

def o = cumdelta[1];
def h = Max(cumdelta, cumdelta[1]);
def l = Min(cumdelta, cumdelta[1]);
def c = cumdelta;

def haclose = (o + h + l + c) / 4;
rec haopen0 = CompoundValue(1, (haopen0[1] + haclose[1]) / 2, haclose);
plot haopen = haopen0;
haopen.sethiding(1);
def hahigh = Max(h, Max(haopen, haclose));
def halo = Min(l, Min(haopen, haclose));
def hacloseup = if haclose > haopen then haclose else double.nan;
def haclosedn = if haclose < haopen then haclose else double.nan;
AddChart(high = hahigh, low = halo, open = haopen, close = hacloseup, ChartType.CANDLE, Color.UPTICK);
AddChart(high = hahigh, low = halo, open = haopen, close = haclosedn, ChartType.CANDLE, Color.DOWNTICK);
Last edited by a moderator:
I have been testing this one as well on TV and i like it, i think it would be useful to have on TOS so i hope someone can give the conversion a try.Hi all,
Could anyone assist with converting this TradingView script to ToS? I've found this to be an extremely useful indicator and having it baked in to ToS would allow me to close TV. I've found some KILLER studies on here that are similar (you guys are amazing), but I'd love to see how they compare.
https://www.tradingview.com/script/vB1T3EMp-Cumulative-Delta-Volume/
Here is an interesting flavor of buy / sell momentum converted from Tradingview.
By removing some detail, it simplifies buying / selling into overall trends.
I still love the Chris Indicator in post #1. But depending on how you are incorporating Volume Pressure, I can see a place for this.
Shared Chart Link: http://tos.mx/j6Sc0TV

By removing some detail, it simplifies buying / selling into overall trends.
I still love the Chris Indicator in post #1. But depending on how you are incorporating Volume Pressure, I can see a place for this.
Shared Chart Link: http://tos.mx/j6Sc0TV
Ruby:
# Converted to TOS from Siyeon's Tradingview "Volume Based Buy and Sell Momentum by 2tm" indicator by NPtechs

declare lower;
input ma_length = 25;
def xROC = (close - close[1]) * 100 / close;

def nRes1 = if (volume < volume[1]) then
               nRes1[1] + xROC
            else
               nRes1[1];

def nRes2 = if (volume > volume[1]) then
               nRes2[1] + xROC
            else
               nRes2[1];

def nRes3 = nRes1 + nRes2;

def nResEMA3 = simpleMovingAvg(nRes1, ma_length) + simpleMovingAvg(nRes2, ma_length);
plot PNVI = nRes3;
plot PEMA = nResEMA3;

input PaintBars = Yes;
AssignPriceColor (if !PaintBars then Color.CURRENT else if PNVI > PEMA then Color.GREEN else Color.RED);

PNVI.SetDefaultColor(GetColor(1));
PNVI.DefineColor("Up Momentum", Color.BLUE);
PNVI.AssignValueColor(PNVI.color("Up Momentum"));

PEMA.SetDefaultColor(GetColor(1));
PEMA.DefineColor("Down Momentum", Color.RED);
PEMA.AssignValueColor(PEMA.color("Down Momentum"));

AddCloud(PNVI,PEMA,PNVI.color("Up Momentum"),PEMA.color("Down Momentum"));vro3
Member
I am laughing at myself.... I've had something called "mobius volume pressure" on my charts for years, and I've never figured it out. I tried a google, and haven't found anything. Anyone know anything about it?! http://tos.mx/Sw7p7Nw
Ruby:
# Volume Pressure
# Mobius
# Mobius at MyTrade
# V01.02.2010

declare lower;

input nVP = 12;
input VPdelta = 12;

plot VP = Sum(((close - open) / (high - low)) * volume, nVP);
def VPup = Average(VP, VPdelta)  >  Average(VP, VPdelta)[1];
def VPdn = Average(VP, VPdelta)  <  Average(VP, VPdelta)[1];
;
VP.SetPaintingStrategy(PaintingStrategy.HISTOGRAM);
VP.SetLineWeight(3);
VP.AssignValueColor(if VP < 0 and VPup
                                            then Color.LIGHT_GREEN
                                            else if VP > 0 and VPup
                                            then Color.GREEN
                                            else if VP > 0 and VPdn
                                            then Color.YELLOW
                                            else  Color.RED);

plot zerobase = if IsNaN(volume) then Double.NaN else 0;
zerobase.SetPaintingStrategy(PaintingStrategy.LINE);
zerobase.SetLineWeight(1);
zerobase.AssignValueColor(if IsAscending(VP, nVP)
                                                        then Color.GREEN
                                                        else  Color.RED);

plot TrendLine = Inertia(VP, 55);
TrendLine.SetLineWeight(3);
TrendLine.AssignValueColor(if Sum(TrendLine > TrendLine[1], 3) == 3
                                                          then Color.Blue                                                        else  Color.YELLOW);
Last edited by a moderator:
The only mention I found of your referenced indicator is from 2018 when Mobius shared it in the ToS ThinkScript Lounge.I am laughing at myself.... I've had something called "mobius volume pressure" on my charts for years, and I've never figured it out. I tried a google, and haven't found anything. Anyone know anything about it?! http://tos.mx/Sw7p7Nw
His complete description on OneNote is:
It is a different take on Buy / Sell Volume PressureVolume Pressure _Mobius
Saturday, April 21, 2018
8:06 PM
Mobius©: this is a pretty popular study and not on the TOS included studies
Most of the Buy / Sell Volume Pressure scripts on this forum look at Buying / Selling Pressure on a bar-by-bar basis.
Mobius takes the Buying / Selling Pressure and averages them over 21 bars.
He also adds an inertia line to filter chop.
I couldn't make his 21 length of bars work (except if you were looking at maybe a monthly chart)
When I changed the length to 12. It became a clearer trend tool.
This has some potential. Thank you for sharing.
Compared to:
https://usethinkscript.com/threads/...cator-labels-for-thinkorswim.8466/#post-75452
https://usethinkscript.com/threads/...labels-for-thinkorswim.8466/page-3#post-98390
mechanik
New member
Good day,
This basic calculation get plotted against the normal TOS volume plot and is all mismatched because of the different y-axis scales on either side, is there a way to make them match? I notice if I adjust indicator y-axis to match a total volume bar against the default total volume bars other bars end up off.
def buying = V*(C-L)/(H-L);
def selling = V*(H-C)/(H-L);
Thanks
Volume Pressure is the sum of the comparison between the close and open over the high - low, weighted by the volume.Good day,
This basic calculation get plotted against the normal TOS volume plot and is all mismatched because of the different y-axis scales on either side, is there a way to make them match? I notice if I adjust indicator y-axis to match a total volume bar against the default total volume bars other bars end up off.
def buying = V*(C-L)/(H-L);
def selling = V*(H-C)/(H-L);
Thanks
Read more here:
https://usethinkscript.com/threads/...labels-for-thinkorswim.8466/page-3#post-97147
Last edited:
Can this be made into normal candles and not HA?Try this
Code:#Heikan Ashi formula candles using CDV Trading View study: #zoyd 05/22 #Addchart does not plot when extended hours are shown declare lower; def tw = high - Max(open, close); def bw = Min(open, close) - low; def body = AbsValue(close - open); def v = volume; def deltaup = if (open <= close) then v * 0.5 * (tw + bw + 2 * body) / (tw + bw + body) else v * 0.5 * (tw + bw) / (tw + bw + body); def deltadown = if (open > close) then v * 0.5 * (tw + bw + 2 * body) / (tw + bw + body) else v * 0.5 * (tw + bw) / (tw + bw + body); def delta = if (close >= open) then deltaup else -1 * deltadown; def cumdelta = TotalSum(delta); def o = cumdelta[1]; def h = Max(cumdelta, cumdelta[1]); def l = Min(cumdelta, cumdelta[1]); def c = cumdelta; def haclose = (o + h + l + c) / 4; rec haopen0 = CompoundValue(1, (haopen0[1] + haclose[1]) / 2, haclose); plot haopen = haopen0; haopen.sethiding(1); def hahigh = Max(h, Max(haopen, haclose)); def halo = Min(l, Min(haopen, haclose)); def hacloseup = if haclose > haopen then haclose else double.nan; def haclosedn = if haclose < haopen then haclose else double.nan; AddChart(high = hahigh, low = halo, open = haopen, close = hacloseup, ChartType.CANDLE, Color.UPTICK); AddChart(high = hahigh, low = halo, open = haopen, close = haclosedn, ChartType.CANDLE, Color.DOWNTICK);
below added HA on/Of with SAM/EMA - best effortCan this be made into normal candles and not HA?
")
#Heikan Ashi formula candles using CDV Trading View study:
#zoyd 05/22
#Addchart does not plot when extended hours are shown
# Added SMA/EMA + Heikan Ashi bar (Yes/No) ++ SAM4COM
declare lower;
input HA_Candles = yes;
input ma1len = 50;
input showma1 = no;
input ma2len = 200;
input showma2 = no;
input ema1len = 50;
input showema1 = no;
input ema2len = 200;
input showema2 = no;
def tw = high - Max(open, close);
def bw = Min(open, close) - low;
def body = AbsValue(close - open);
def v = volume;
def deltaup = if (open <= close) then v * 0.5 * (tw + bw + 2 * body) / (tw + bw + body) else v * 0.5 * (tw + bw) / (tw + bw + body);
def deltadown = if (open > close) then v * 0.5 * (tw + bw + 2 * body) / (tw + bw + body) else v * 0.5 * (tw + bw) / (tw + bw + body);
def delta = if (close >= open) then deltaup else -1 * deltadown;
def cumdelta = TotalSum(delta);
def o = cumdelta[1];
def h = Max(cumdelta, cumdelta[1]);
def l = Min(cumdelta, cumdelta[1]);
def c = cumdelta;
def haclose = (o + h + l + c) / 4;
rec haopen0 = CompoundValue(1, (haopen0[1] + haclose[1]) / 2, haclose);
plot haopen = haopen0;
haopen.sethiding(1);
haopen.EnableApproximation ();
def hahigh = Max(h, Max(haopen, haclose));
def halo = Min(l, Min(haopen, haclose));
def hacloseup = if haclose > haopen then haclose else double.nan;
def haclosedn = if haclose < haopen then haclose else double.nan;
def closeup = if close > open then c else double.nan;
def closedn = if close < open then c else double.nan;
AddChart(high = if HA_Candles then hahigh else h, low = if HA_Candles then halo else l, open = if HA_Candles then haopen else o, close = if HA_Candles then hacloseup else closeup, ChartType.CANDLE, Color.UPTICK);
AddChart(high = if HA_Candles then hahigh else h, low = if HA_Candles then halo else l, open = if HA_Candles then haopen else o, close = if HA_Candles then haclosedn else closedn, ChartType.CANDLE, Color.DOWNTICK);
def c_ = if HA_Candles then haclose else c;
plot SMA_1 = if showma1 then SimpleMovingAvg(c_,ma1len) else Double.NaN;
plot SMA_2 = if showma2 then SimpleMovingAvg(c_,ma2len)else Double.NaN;
plot EMA_1 = if showema1 then ExpAverage(c_,ema1len)else Double.NaN;
plot EMA_2 = if showema2 then ExpAverage(c_,ema2len)else Double.NaN;
SMA_1.setDefaultColor(color.lime);
SMA_2.setDefaultColor(color.red);
EMA_1.setDefaultColor(color.lime);
EMA_2.setDefaultColor(color.red);
##End
Volume Pressure _Mobius
Saturday, April 21, 2018
8:06 PM
Mobius©: this is a pretty popular study and not on the TOS included studies
I am using this Volume Pressure _Mobius script with 21,21 but seeing more color like blue, yellow, light green, red, Green, white. which i am not sure what those color indicates?
Checked the script but unable to understand. please help me out about the signification of colors.
Volume Pressure _Mobius
Saturday, April 21, 2018
8:06 PM
Mobius©: this is a pretty popular study and not on the TOS included studies
I am using this Volume Pressure _Mobius script with 21,21 but seeing more color like blue, yellow, light green, red, Green, white. which i am not sure what those color indicates?
Checked the script but unable to understand. please help me out about the signification of colors.
Mobius did not provide any additional documentation with this study.
Here is a comparison of Mobius's study versus other Volume Pressure Indicators:
https://usethinkscript.com/threads/...labels-for-thinkorswim.8466/page-3#post-98436
Analyze these across multiple aggregations, and watch what they tell you about your trade. You will be able to decide if the colors are meaningful for you or if one of the other volume pressure indicators provide the best information about your trades.
Keep in mind that this is not an apples-to-apples comparison. Mobius looks at volume pressure across a period of time whereas all other volume pressure indicators are immediate bar-by-bar signals.
Last edited:
Was wondering if it's possible to add the actual % when hovering over a volume bar. If I cant hover, maybe a bubble? OR, show the info the left in a data box? I attached a photo of the idea.

I would use this on higher time frames like Weekly and Monthly to see the split.
Also, when I go to any timeframe over Daily, the volume script disappears. Anyway help is appreciated. Thank You!
I would use this on higher time frames like Weekly and Monthly to see the split.
Also, when I go to any timeframe over Daily, the volume script disappears. Anyway help is appreciated. Thank You!
Code:
#HINT: This study color codes volume by amount of volume on up-tick versus amount of volume on down-tick

declare lower;

def O = open;
def H = high;
def C = close;
def L = low;
def V = volume;
def Buying = V*(C-L)/(H-L);
def Selling = V*(H-C)/(H-L);

# Selling Volume
 Plot SV = selling;
 SV.setPaintingStrategy(PaintingStrategy.Histogram);
 SV.SetDefaultColor(Color.Red);
 SV.HideTitle();
 SV.HideBubble();
 SV.SetLineWeight(5);

# Buying Volume
# Plot BV = Buying;
# Note that Selling + Buying Volume = Volume.
 Plot BV =  volume;
 BV.setPaintingStrategy(PaintingStrategy.Histogram);
 BV.SetDefaultColor(Color.Dark_Green);
 BV.HideTitle();
 BV.HideBubble();
 BV.SetLineWeight(5);

#Inputs
input Show30DayAvg = yes;
input ShowTodayVolume =  yes;
input ShowPercentOf30DayAvg = yes;
input UnusualVolumePercent = 200;
input Show30BarAvg = yes;
input ShowCurrentBar = yes;


#Volume Data
def volLast30DayAvg = (volume(period = "DAY")[1] + volume(period = "DAY")[2] + volume(period = "DAY")[3] + volume(period = "DAY")[4] + volume(period = "DAY")[5] + volume(period = "DAY")[6] + volume(period = "DAY")[7] + volume(period = "DAY")[8] + volume(period = "DAY")[9] + volume(period = "DAY")[10] + volume(period = "DAY")[11] + volume(period = "DAY")[12] + volume(period = "DAY")[13] + volume(period = "DAY")[14] + volume(period = "DAY")[15] + volume(period = "DAY")[16] + volume(period = "DAY")[17] + volume(period = "DAY")[18] + volume(period = "DAY")[19] + volume(period = "DAY")[20] + volume(period = "DAY")[21] + volume(period = "DAY")[22] + volume(period = "DAY")[23] + volume(period = "DAY")[24] + volume(period = "DAY")[25] + volume(period = "DAY")[26] + volume(period = "DAY")[27] + volume(period = "DAY")[28] + volume(period = "DAY")[29] + volume(period = "DAY")[30]) / 30;
def today = volume(period = "DAY");
def percentOf30Day = Round((today / volLast30DayAvg) * 100, 0);
#def avg30Bars = VolumeAvg(30).VolAvg;
def avg30Bars = (volume[1] + volume[2] + volume[3] + volume[4] + volume[5] + volume[6] + volume[7] + volume[8] + volume[9] + volume[10] + volume[11] + volume[12] + volume[13] + volume[14] + volume[15] + volume[16] + volume[17] + volume[18] + volume[19] + volume[20] + volume[21] + volume[22] + volume[23] + volume[24] + volume[25] + volume[26] + volume[27] + volume[28] + volume[29] + volume[30]) / 30;
def curVolume = volume;


# Labels
AddLabel(Show30DayAvg, "Daily Avg: " + Round(volLast30DayAvg, 0), Color.LIGHT_GRAY);
AddLabel(ShowTodayVolume, "Today: " + today, (if percentOf30Day >= UnusualVolumePercent then Color.GREEN else if percentOf30Day >= 100 then Color.ORANGE else Color.LIGHT_GRAY));


#Create an average volume line based on last 50 bars

input length = 50;
plot Vol = volume;
plot VolAvg = Average(volume, length);
Vol.SetPaintingStrategy(PaintingStrategy.HISTOGRAM);Was wondering if it's possible to add the actual % when hovering over a volume bar. If I cant hover, maybe a bubble? OR, show the info the left in a data box? I attached a photo of the idea.

I would use this on higher time frames like Weekly and Monthly to see the split.
Also, when I go to any timeframe over Daily, the volume script disappears. Anyway help is appreciated. Thank You!
Code:#HINT: This study color codes volume by amount of volume on up-tick versus amount of volume on down-tick declare lower; def O = open; def H = high; def C = close; def L = low; def V = volume; def Buying = V*(C-L)/(H-L); def Selling = V*(H-C)/(H-L); # Selling Volume Plot SV = selling; SV.setPaintingStrategy(PaintingStrategy.Histogram); SV.SetDefaultColor(Color.Red); SV.HideTitle(); SV.HideBubble(); SV.SetLineWeight(5); # Buying Volume # Plot BV = Buying; # Note that Selling + Buying Volume = Volume. Plot BV = volume; BV.setPaintingStrategy(PaintingStrategy.Histogram); BV.SetDefaultColor(Color.Dark_Green); BV.HideTitle(); BV.HideBubble(); BV.SetLineWeight(5); #Inputs input Show30DayAvg = yes; input ShowTodayVolume = yes; input ShowPercentOf30DayAvg = yes; input UnusualVolumePercent = 200; input Show30BarAvg = yes; input ShowCurrentBar = yes; #Volume Data def volLast30DayAvg = (volume(period = "DAY")[1] + volume(period = "DAY")[2] + volume(period = "DAY")[3] + volume(period = "DAY")[4] + volume(period = "DAY")[5] + volume(period = "DAY")[6] + volume(period = "DAY")[7] + volume(period = "DAY")[8] + volume(period = "DAY")[9] + volume(period = "DAY")[10] + volume(period = "DAY")[11] + volume(period = "DAY")[12] + volume(period = "DAY")[13] + volume(period = "DAY")[14] + volume(period = "DAY")[15] + volume(period = "DAY")[16] + volume(period = "DAY")[17] + volume(period = "DAY")[18] + volume(period = "DAY")[19] + volume(period = "DAY")[20] + volume(period = "DAY")[21] + volume(period = "DAY")[22] + volume(period = "DAY")[23] + volume(period = "DAY")[24] + volume(period = "DAY")[25] + volume(period = "DAY")[26] + volume(period = "DAY")[27] + volume(period = "DAY")[28] + volume(period = "DAY")[29] + volume(period = "DAY")[30]) / 30; def today = volume(period = "DAY"); def percentOf30Day = Round((today / volLast30DayAvg) * 100, 0); #def avg30Bars = VolumeAvg(30).VolAvg; def avg30Bars = (volume[1] + volume[2] + volume[3] + volume[4] + volume[5] + volume[6] + volume[7] + volume[8] + volume[9] + volume[10] + volume[11] + volume[12] + volume[13] + volume[14] + volume[15] + volume[16] + volume[17] + volume[18] + volume[19] + volume[20] + volume[21] + volume[22] + volume[23] + volume[24] + volume[25] + volume[26] + volume[27] + volume[28] + volume[29] + volume[30]) / 30; def curVolume = volume; # Labels AddLabel(Show30DayAvg, "Daily Avg: " + Round(volLast30DayAvg, 0), Color.LIGHT_GRAY); AddLabel(ShowTodayVolume, "Today: " + today, (if percentOf30Day >= UnusualVolumePercent then Color.GREEN else if percentOf30Day >= 100 then Color.ORANGE else Color.LIGHT_GRAY)); #Create an average volume line based on last 50 bars input length = 50; plot Vol = volume; plot VolAvg = Average(volume, length); Vol.SetPaintingStrategy(PaintingStrategy.HISTOGRAM);
that study uses 2nd aggregation of DAY, so if the chart time is larger than day, then that section will have errors, and possibly crash the study.
-------------
that ratio isn't the same as time and sales data. T-S data isn't available inthinkscript.
------------------
add this to the end of your study,
it should draw 5 bubbles off to the right, after the last bar
( typing on my cell, i think this will work..)
Code:
# Show volume BUY/SELL % to the right of last bar

#def lastbar = ( !isnan(close) and isnan(close[-1]) );
#def lastbn = highestall( if lastbar then bn else 0)

# plots a bubble x bars after last bar
input bars_in_future = 3;
def bif = bars_in_future;
def cls = close;
def x = isNaN(cls[bif]) and !isNaN(cls[bif+1]);
# use this on upper chart
#def vert = cls[bif+1];
def vert = 0;
input show = yes;

#volume
#buy vol  buying
#buy vol %
#sell vol %
#sell vol  selling

# draw bubbles in reverse order, on same point, to have them stack

AddChartBubble(show and x, vert, selling[bif+1], color.red, yes);

AddChartBubble(show and x, vert,
round((selling[bif+1]/volume[bif+1]) *100,1) + "%",  color.red, yes);

AddChartBubble(show and x, vert,
round((buying[bif+1]/volume[bif+1]) *100,1) + "%",  color.green, yes);

AddChartBubble(show and x, vert, buying[bif+1], color.green, yes);

AddChartBubble(show and x, vert, volume[bif+1], color.white, yes);
#
Last edited:
Thank you! Is there any way to separate the information possibly when I hover the candle? or maybe just show the info over each volume bar? Also, How can I change it from 2nd aggregation so that it can work on weekly and monthly time frames? Thank you!that study uses 2nd aggregation of DAY, so if the chart time is larger than day, then that section will have errors, and possibly crash the study.
-------------
that ratio isn't the same as time and sales data. T-S data isn't available inthinkscript.
------------------
add this to the end of your study,
it should draw 5 bubbles off to the right, after the last bar
( typing on my cell, i think this will work..)
Code:# Show volume BUY/SELL % to the right of last bar #def lastbar = ( !isnan(close) and isnan(close[-1]) ); #def lastbn = highestall( if lastbar then bn else 0) # plots a bubble x bars after last bar input bars_in_future = 3; def bif = bars_in_future; def cls = close; def x = isNaN(cls[bif]) and !isNaN(cls[bif+1]); # use this on upper chart #def vert = cls[bif+1]; def vert = 0; input show = yes; #volume #buy vol buying #buy vol % #sell vol % #sell vol selling # draw bubbles in reverse order, on same point, to have them stack AddChartBubble(show and x, vert, selling[bif+1], color.red, yes); AddChartBubble(show and x, vert, round((selling[bif+1]/volume[bif+1]) *100,1) + "%", color.red, yes); AddChartBubble(show and x, vert, round((buying[bif+1]/volume[bif+1]) *100,1) + "%", color.green, yes); AddChartBubble(show and x, vert, buying[bif+1], color.green, yes); AddChartBubble(show and x, vert, volume[bif+1], color.white, yes); #
Thank you! Is there any way to separate the information possibly when I hover the candle? or maybe just show the info over each volume bar? Also, How can I change it from 2nd aggregation so that it can work on weekly and monthly time frames? Thank you!

a version to show bubbles above each vol bar
Code:
input show = yes;
#volume
#buy vol buying
#buy vol %
#sell vol %
#sell vol selling
# draw bubbles in reverse order, on same point, to have them stack

def v = volume;
AddChartBubble(show, v, selling, color.red, yes);
AddChartBubble(show, v,  round((selling/volume) *100,1) + "%", color.red, yes);
AddChartBubble(show, v,  round((buying/volume) *100,1) + "%", color.green, yes);
AddChartBubble(show, v, buying, color.green, yes);
AddChartBubble(show, v, volume, color.white, yes);
#Similar threads
-
-
NextSignals Aggressive Buy & Sell Pressure Volume For ThinkOrSwim
- Started by Tiredoflosing
- Replies: 9
-
Buy Sell Volume Pressure - Alternate Indicator For ThinkOrSwim
- Started by thebewb
- Replies: 0
-

-
 Volume Buy Sell Pressure with Hot Percent for ThinkorSwim
- Started by horserider
- Replies: 126
Not the exact question you're looking for?
Start a new thread and receive assistance from our community.
87k+
Posts
495
Online
Similar threads
-
-
NextSignals Aggressive Buy & Sell Pressure Volume For ThinkOrSwim
- Started by Tiredoflosing
- Replies: 9
-
Buy Sell Volume Pressure - Alternate Indicator For ThinkOrSwim
- Started by thebewb
- Replies: 0
-
-
Volume Buy Sell Pressure with Hot Percent for ThinkorSwim
- Started by horserider
- Replies: 126
The Market Trading Game Changer
Join 2,500+ subscribers inside the useThinkScript VIP Membership Club
- Exclusive indicators
- Proven strategies & setups
- Private Discord community
- ‘Buy The Dip’ signal alerts
- Exclusive members-only content
- Add-ons and resources
- 1 full year of unlimited support
Frequently Asked Questions
What is useThinkScript?
useThinkScript is the #1 community of stock market investors using indicators and other tools to power their trading strategies. Traders of all skill levels use our forums to learn about scripting and indicators, help each other, and discover new ways to gain an edge in the markets.
How do I get started?
We get it. Our forum can be intimidating, if not overwhelming. With thousands of topics, tens of thousands of posts, our community has created an incredibly deep knowledge base for stock traders. No one can ever exhaust every resource provided on our site.
If you are new, or just looking for guidance, here are some helpful links to get you started.
- The most viewed thread:
https://usethinkscript.com/threads/repainting-trend-reversal-for-thinkorswim.183/ - Our most popular indicator:
https://usethinkscript.com/threads/buy-the-dip-indicator-for-thinkorswim.3553/ - Answers to frequently asked questions:
https://usethinkscript.com/threads/answers-to-commonly-asked-questions.6006/
What are the benefits of VIP Membership?
VIP members get exclusive access to these proven and tested premium indicators: Buy the Dip, Advanced Market Moves 2.0, Take Profit, and Volatility Trading Range. In addition, VIP members get access to over 50 VIP-only custom indicators, add-ons, and strategies, private VIP-only forums, private Discord channel to discuss trades and strategies in real-time, customer support, trade alerts, and much more. Learn all about VIP membership here.
How can I access the premium indicators?
To access the premium indicators, which are plug and play ready, sign up for VIP membership here.