input Number_Of_Consecutive_Lows = 5;
input Number_Of_Consecutive_Highs = 5;
input Reset_Time = 0930;
def Start ;
if GetAggregationPeriod() < AggregationPeriod.DAY {
Start = SecondsTillTime(Reset_Time) == 0;
} else {
Start = Double.NaN;}
def Bar = if !IsNaN(close) and BarNumber()>0 then BarNumber() else Bar[1];
########################################################################
#Do Not Remove Line of Code in this box. #
def FinalBar = if IsNaN(close[-1000]) then Bar[-1000] else FinalBar[1];#
########################################################################
def HigherLows;
if !IsNaN(Start) {
HigherLows = if IsNaN(close) or SecondsTillTime(Reset_Time) == 0 then 0 else if low >= low[1] then HigherLows[1]+1 else 0;
}else {
HigherLows = if IsNaN(close) then 0 else if low >= low[1] then HigherLows[1]+1 else 0;}
def TargetHigherLows = if !IsNaN(Start) then if SecondsTillTime(Reset_Time)[-1] == 0 then 0 else fold z = 0 to Bar while GetValue(low,-(z+1)) >= GetValue(low,-z) do GetValue(HigherLows,-z-1)+1 else fold w = 0 to Bar while GetValue(low,-(w+1)) >= GetValue(low,-w) do GetValue(HigherLows,-w-1)+1;
def ConsecutiveHigherLowsEndBN = fold a = 0 to Bar while GetValue(low,-(a+1)) >= GetValue(low,-a) do GetValue(Bar,-a-1);
def ConsecutiveHigherLowsStartBN = if HigherLows == 0 then Bar else 0;
def ConsecutiveHigherLowsEndLow = fold c = 0 to Bar while GetValue(low,-(c+1)) >= GetValue(low,-c) do GetValue(low,-c-1);
def ConsecutiveHigherLowsStartLow = if HigherLows == 0 then low else 0;
def ConsecutiveHigherLowsSlope = if HigherLows == 0 then (ConsecutiveHigherLowsEndLow - ConsecutiveHigherLowsStartLow)/(ConsecutiveHigherLowsEndBN - ConsecutiveHigherLowsStartBN) else ConsecutiveHigherLowsSlope[1];
def ConsecutiveHigherLowsLine = if HigherLows == 0 then low else if low < low[1] then Double.NaN else ConsecutiveHigherLowsLine[1] + ConsecutiveHigherLowsSlope;
def LowerHighs;
if !IsNaN(Start) {
LowerHighs = if IsNaN(close) or SecondsTillTime(Reset_Time) == 0 then 0 else if high <= high[1] then LowerHighs[1]+1 else 0;
}else {
LowerHighs = if IsNaN(close) then 0 else if high <= high[1] then LowerHighs[1]+1 else 0;}
def TargetLowerHighs = if !IsNaN(Start) then if SecondsTillTime(Reset_Time)[-1] == 0 then 0 else fold y = 0 to Bar while GetValue(high,-(y+1)) <= GetValue(high,-y) do GetValue(LowerHighs,-y-1)+1 else fold x = 0 to Bar while GetValue(high,-(x+1)) <= GetValue(high,-x) do GetValue(LowerHighs,-x-1)+1;
def ConsecutiveLowerHighsEndBN = fold b = 0 to Bar while GetValue(high,-(b+1)) <= GetValue(high,-b) do GetValue(Bar,-b-1);
def ConsecutiveLowerHighsStartBN = if LowerHighs == 0 then Bar else 0;
def ConsecutiveLowerHighsEndHigh = fold d = 0 to Bar while GetValue(high,-(d+1)) <= GetValue(high,-d) do GetValue(high,-d-1);
def ConsecutiveLowerHighsStartHigh = if LowerHighs == 0 then high else 0;
def ConsecutiveLowerHighsSlope = if LowerHighs == 0 then (ConsecutiveLowerHighsEndHigh - ConsecutiveLowerHighsStartHigh)/(ConsecutiveLowerHighsEndBN - ConsecutiveLowerHighsStartBN) else ConsecutiveLowerHighsSlope[1];
def ConsecutiveLowerHighsLine = if LowerHighs == 0 then high else if high > high[1] then Double.NaN else ConsecutiveLowerHighsLine[1] + ConsecutiveLowerHighsSlope;
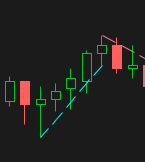
plot ConsecutiveHigherLowsPlot = if (TargetHigherLows >= Number_Of_Consecutive_Lows) or (HigherLows >= Number_Of_Consecutive_Lows) or (TargetHigherLows[1] >= Number_Of_Consecutive_Lows and low >= low[1]) then ConsecutiveHigherLowsLine else Double.NaN;
ConsecutiveHigherLowsPlot.SetStyle(Curve.MEDIUM_DASH);
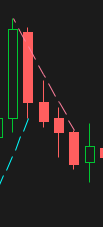
plot ConsecutiveLowerHighsPlot = if (TargetLowerHighs >= Number_Of_Consecutive_Highs) or (LowerHighs >= Number_Of_Consecutive_Highs) or (TargetLowerHighs[1] >= Number_Of_Consecutive_Highs and high <= high[1]) then ConsecutiveLowerHighsLine else Double.NaN;
ConsecutiveLowerHighsPlot.SetStyle(Curve.MEDIUM_DASH);