Connors 2 Period RSI Trading Indicator for ThinkorSwim

markos

Well-known member
VIP
ljfl9Dp.png

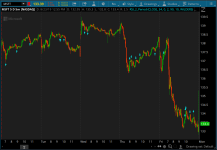
"Connors 2 Period RSI trading" refers to a trading strategy developed by Larry Connors that utilizes a very short-term Relative Strength Index (RSI) with a lookback period of just 2, aiming to capitalize on quick price reversals and mean reversion opportunities within a trend by identifying extremely overbought or oversold conditions on the market.

Key points about Connors 2 Period RSI trading:
  • Short-term focus:
    Due to the 2-period RSI setting, this strategy is designed for very short-term trading, often within a single trading session.

  • Mean reversion principle:
    The core idea is that after a sharp price movement, the market tends to revert back towards the average, providing potential entry points when the RSI reaches extreme levels.

  • Buy signals:
    Traders look for buy signals when the 2-period RSI dips below a very low level (like 10), indicating a possible oversold condition.

  • Sell signals:
    Conversely, sell signals are generated when the 2-period RSI spikes above a very high level (like 90), signifying potential overbought conditions.
Important considerations:
  • Market volatility:
    This strategy is most effective in volatile markets where price swings occur frequently, allowing for quick entries and exits.

  • Trend confirmation:
    While the 2-period RSI can identify potential reversals, it's crucial to confirm the overall trend direction using other technical indicators or price action analysis to avoid false signals.

  • Risk management:
    Due to the aggressive nature of this strategy, strict risk management practices like stop-loss orders are essential to limit potential losses.

There are 4 steps to the strategy. Get it Here (Also an excellent resource for Technical Analysis: https://school.stockcharts.com/doku.php?id=trading_strategies:rsi2


Code:
# ConnorsRSI Indicator

declare lower;

input Price_RSI_Period = 3;
input Streak_RSI_Period = 2;
input Rank_Lookback = 100;
input OVER_BOUGHT = 90;
input OVER_SOLD = 10;
input SR_LENGTH = 35;
input PRICE = CLOSE;

# Component 1: the RSI of closing price
def priceRSI = reference RSI("price" = PRICE, "length" = Price_RSI_Period);

# Component 2: the RSI of the streak
def upDay = if PRICE > PRICE[1] then 1 else 0;
def downDay = if PRICE < PRICE[1] then -1 else 0;
def upStreak = if upDay != 0 then upStreak[1] + upDay else 0;
def downStreak = if downDay != 0 then downStreak[1] + downDay else 0;
def streak = upStreak + downStreak;
def streakRSI = reference RSI("price" = streak, "length" = Streak_RSI_Period);

# Componenet 3: The percent rank of the current return
def ROC1 = PRICE / PRICE[1] - 1;

def rank = fold i = 1 to Rank_Lookback + 1 with r = 0 do
r + (GetValue(ROC1, i, Rank_Lookback) < ROC1) ;

def pctRank = (rank / Rank_Lookback) * 100 ;

# The final ConnorsRSI calculation, combining the three components
plot ConnorsRSI = round((priceRSI + streakRSI + pctRank) / 3, NUMBEROFDIGITS = 0);

plot SR_HIGH = Round(Highest(ConnorsRSI, LENGTH = SR_LENGTH), NUMBEROFDIGITS = 0);

plot SR_LOW = Round(Lowest(ConnorsRSI, LENGTH = SR_LENGTH), NUMBEROFDIGITS = 0);

ConnorsRSI.AssignValueColor(if ConnorsRSI >= OVER_BOUGHT then Color.Red else if ConnorsRSI <= OVER_SOLD then Color.Green else Color.Gray);
ConnorsRSI.SetLineWeight(3);

SR_HIGH.SetDefaultColor(Color.CYAN);
SR_HIGH.SetLineWeight(1);

SR_LOW.SetDefaultColor(Color.CYAN);
SR_LOW.SetLineWeight(1);

plot OVERBOUGHT = OVER_BOUGHT;
OVERBOUGHT.SetDefaultColor(Color.DARK_GRAY);
OVERBOUGHT.Hide();
OVERBOUGHT.HideBubble();

plot OVERSOLD = OVER_SOLD;
OVERSOLD.SetDefaultColor(Color.DARK_GRAY);
OVERSOLD.Hide();
OVERSOLD.HideBubble();
 
Last edited by a moderator:
@markos I showed the buys and sells in the other thread on Ultimate RSI. You could copy those here if you wish. Edit them if you think it is necessary. Definitely short term trading to stack very small profits up. You will be in and out most likely for a profit but will miss any long trend. I think it is only practical for an auto trading system.
 
@horserider I would tend to agree with you about the practicality. I don't use it but others might. If not careful, one could blow up an account quick.

I created this thread because it was mentioned elsewhere and we, as a group, need to try and not deviate within a thread as I have done in the past. Then good ideas can get lost.
My CPU is fried, my only ToS is on mobile. I won't have my laptop back from repair for 1-2 weeks. :cry:

Please feel free and post your Connors RSI(2) here when you can.
If you do, please post it according to the rules laid out above, for the purists. ;)
 
Hi Ben, I saw a youtube video with a cool and simple trading strategy that uses the RSI as a trigger with over bought/oversold levels that are filtered out by a moving average of your choice. The link to the video is:

.

In essence, the user can define the moving average. Id prefer the 34 ema since I already use that on my charts. If price is above and RSI 2 period is below 10 then it is a dip buy opportunity. On the flip side if price is below the 34 ema and RSI is above 90 then it is a sell the rally opportunity.

Being able to run a scan for this would be nice. I did something simple using TOS but i know it isn't correct and gives me false alerts which I don't mind because at least it does show some decent looking opportunities I wouldn't have seen otherwise. The problem is I work too much to look at charts all day and figure out which ones I want or don't want to trade.
 
Last edited by a moderator:
See if this works for you. Included arrows to help you look for signals on the chart and also be able to use the Scanner with it.

B8ALbA7.png


Code:
# Simple 2 Period RSI Trading Indicator
# Assembled by BenTen at useThinkScript.com
# You are free to use this code for personal use, and make derivative works from it. You are NOT GRANTED permission to use this code (or derivative works) for commercial purposes which includes and is not limited to selling, reselling, or packaging with other commercial indicators. Headers and attribution in this code should remain as provided, and any derivative works should extend the existing headers.

# Start EMA
input price = close;
input length = 34;
input displace = 0;
#input showBreakoutSignals = no;

def AvgExp = ExpAverage(price[-displace], length);
#plot UpSignal = price crosses above AvgExp;
#plot DownSignal = price crosses below AvgExp;

# RSI
input RSIlength = 2;
input over_Bought = 90;
input over_Sold = 10;
input averageType = AverageType.WILDERS;
def NetChgAvg = MovingAverage(averageType, price - price[1], RSIlength);
def TotChgAvg = MovingAverage(averageType, AbsValue(price - price[1]), RSIlength);
def ChgRatio = if TotChgAvg != 0 then NetChgAvg / TotChgAvg else 0;
def RSI = 50 * (ChgRatio + 1);
def OverSold = over_Sold;
def OverBought = over_Bought;

def emaBull = price > AvgExp;
def emaBear = price < AvgExp;

# Define Warning Signals
def bullish = RSI(length = RSIlength, averageType = averageType) < over_Sold and emaBull;
def bearish = RSI(length = RSIlength, averageType = averageType) > over_Bought and emaBear;

# Paint the Trend
#AssignPriceColor(if bullish then Color.DARK_GREEN else if bearish then Color.DARK_RED else Color.CURRENT);

plot bull = bullish;
bull.AssignValueColor(Color.CYAN);
bull.SetPaintingStrategy(PaintingStrategy.BOOLEAN_ARROW_UP);

plot bear = bearish;
bear.AssignValueColor(Color.CYAN);
bear.SetPaintingStrategy(PaintingStrategy.BOOLEAN_ARROW_DOWN);

Shareable Link

https://tos.mx/GBnw6w
 

Attachments

  • B8ALbA7.png
    B8ALbA7.png
    87.7 KB · Views: 404
Last edited:
I just want to add. The most important thing to trade indicator is to understand what it means. RSI is - relative strength index. But what does period of 14 RSI with value 70 means? it means that 70% of time over the length the trend was rising. Not oversold , not overbought. But just precisely that
So by varying various length and tweaking "ob/os" we just tweaking indicator to tell us what kind of strength we looking for over what period of time

So RSI(2) 90/2 Is merely 4 bar ema strength signal (because 2 is wilders and wilders=2x EMA). with 90 means we want trend rising 90 of time(or 10 - conversely rising only 10 of time - e.g weakening). So there is no magic with this various length techniques. By using RSI(2)/RSI (14) you achieve confluence of larger price trend with shorter price trend. Whether it works on your particular timeframe and security is another matter

The most critical piece about oscillator like RSI is to determine the lenght. - e.g. the length over which cycle tend to occur. Using RSI OB/OS levels is in a way not much different than using candle count techniques (e.g 5 candles-in one trend - trend too overxtended. ) It is obvious why using OB/OS fails in long smooth trends - "the cycle" does not occur. it goes precisely as RSI tells it ( e.g over 80/90 candles are uptrending - nothing OB about it).
and hence why RSI/Stoch is a supposedely only good in ranged market (which typically have a clear cycle length)

Here is example of using RSI in different way:
1) find strong stock on long TF- e.g. "RSI(50)>70
2) On it find a shorter wave in sideways pullback RSI(21) ~50
3) And coming out of a downwave on faster timeframe RSI(13)crossing 50
 
Last edited:
@skynetgen Thx for the RSI tutorial. Definitely enlightening. I notice this kind of indicator suits a trending market so I will create a watchlist of stocks that mainly trend and use it on those.
 
Hi, I wanted to know if anyone can help me ...
Purchase Condition:
Time Frame M1
RSI (2) <10
Time Frame M5
RSI (7)> 60
RSI (7) <80
Time Frame M15
RSI (7)> 60
RSI (7) <80

Sale condition:
Time Frame M1
RSI (2)> 90
Time Frame M5
RSI (7) <40
RSI (7)> 20
Time Frame M15
RSI (7) <40
RSI (7)> 20

Is there a possibility of being in M1 and if the conditions in the three time frames are met, does an arrow appear indicating long or short?

Many thanks!!
 
@jcga1981

i see your comment here the idea is good but i m not very sure weather rsi(2) will hit below 10 on 1 min time frame while being above 60 in 5 min time frame because being above 60 on 5 min with rsi(7) is bullish but it still deserve a check

coz i am the one who introduce here rsi(7) >60 trading technique

i am not a coder so still its better that the developers in this forum shuld help it
 
I had this custom coded but im not getting many signals when I do get a signal it works great but its once in a blue moon. Can someone look and see if you can tweek for more signals?

Code:
# MTS200517 Scan for Hector eml
# Name: MTS_HectorII_200517Scan
# Intended to run on daily TF only
declare hide_on_intraday;
Declare Lower;
Input W_PercentBelowPriorClose = 3;
Input X_BottomPercentileLimit = 10;
Input ConnorsRSILimit = 5;

Def CloseCond = close>5;
Def AvgVolCond = average(volume,21)>250000;
Def ADXCond = ADX(10)>30;
Def WCond = low<(100-W_PercentBelowPriorClose)/100*Low[1];
Def XCond = High-close > (100-X_BottomPercentileLimit)/100 * (high-low);

# MTS2005 Connors RSI Interpretation
# declare lower;
input ClasicRSILenght = 3;
input StreakRSILenght = 2;
input PercentRankLookback = 30;
# Clasic RSI
def priceRSI = RSI(ClasicRSILenght);
# RSI of the streak
def upDay = close > close[1];
def downDay = close < close[1];
def upStreak = if upDay then upStreak[1] + upDay else 0;
def downStreak = if downDay then downStreak[1] - downDay else 0;
def streak = upStreak + downStreak;
def streakRSI = RSI("price" = streak, "length" = StreakRSILenght);
# Percent rank
def ROC1 = close / close[1] - 1;
def rank = fold i = 1 to PercentRankLookback + 1 with r = 0 do
r + (GetValue(ROC1, i, PercentRankLookback) < ROC1) ;
def pctRank = (rank / PercentRankLookback) * 30 ;
# ConnorsRSI Final
Def ConnorsRSI = (priceRSI + streakRSI + pctRank) / 3;

Def ConnorsCond = ConnorsRSI<ConnorsRSILimit;

Plot Scan =  CloseCond AND AvgVolCond AND ADXCond AND WCond AND XCond AND ConnorsCond;
 
Last edited by a moderator:
Hey all i am a newby trying to find my adult job. I have been in the army since the day after 9/11. I retire from 20 years. I am an infantryman and know my body is broke and won't be able to do physical labor when I am older. haha. I am somewhat new to the market and really enjoy all the coding and charting. I don't know how to code or strategy. I am doing the thinkorswim education on it. I find it very helpful.
I found a strategy that I would like to try
I will do try. I am trying to find away to code this strat For tos And trading view.

Cm rsi 2 lower strat
Money flow index
Rsi
Together and have a buy indicator
Cm under 3
Mfi under 20
Rsi 30 or less

Also I am trying to find a way to find support when these criteria are met.

Can someone point me in the right direction
 
@Matthew.w.mickey This will color your candles cyan if all 3 conditions are met.

Code:
declare upper;

input length = 14;
input over_Bought = 70;
input over_Sold = 30;
input length_connor = 2;
input overbought_connor = 90;
input oversold_connor = 3;
input price = close;
input averageType = AverageType.WILDERS;
input overSold_MFI = 20;
input overBought_MFI = 80;
input length_MFI = 14;
input movingAvgLength_MFI = 1;

def NetChgAvg = MovingAverage(averageType, price - price[1], length);
def TotChgAvg = MovingAverage(averageType, AbsValue(price - price[1]), length);
def ChgRatio = if TotChgAvg != 0 then NetChgAvg / TotChgAvg else 0;

def RSI = 50 * (ChgRatio + 1);

def NetChgAvg_connor = MovingAverage(averageType, price - price[1], length_connor);
def TotChgAvg_connor = MovingAverage(averageType, AbsValue(price - price[1]), length_connor);
def ChgRatio_connor = if TotChgAvg_connor != 0 then NetChgAvg_connor / TotChgAvg_connor else 0;

def RSI_connor = 50 * (ChgRatio_connor + 1);

def MoneyFlowIndex = Average(moneyflow(high, close, low, volume, length_MFI), movingAvgLength_MFI);

AssignPriceColor(if RSI < over_Sold and RSI_connor < oversold_connor and MoneyFlowIndex < overSold_MFI then color.CYAN else color.CURRENT);
 
hey ben I found a video someone shared on YouTube its the video with the code that puts the arrows on the chart can you tell me exactly what's those arrows do and also I can't find the code for that on here to copy

cd0U1wl.png


this is the script I found but want to know how its used
 
Last edited by a moderator:

Join useThinkScript to post your question to a community of 21,000+ developers and traders.

Similar threads

Not the exact question you're looking for?

Start a new thread and receive assistance from our community.

87k+ Posts
277 Online
Create Post

Similar threads

Similar threads

The Market Trading Game Changer

Join 2,500+ subscribers inside the useThinkScript VIP Membership Club
  • Exclusive indicators
  • Proven strategies & setups
  • Private Discord community
  • ‘Buy The Dip’ signal alerts
  • Exclusive members-only content
  • Add-ons and resources
  • 1 full year of unlimited support

Frequently Asked Questions

What is useThinkScript?

useThinkScript is the #1 community of stock market investors using indicators and other tools to power their trading strategies. Traders of all skill levels use our forums to learn about scripting and indicators, help each other, and discover new ways to gain an edge in the markets.

How do I get started?

We get it. Our forum can be intimidating, if not overwhelming. With thousands of topics, tens of thousands of posts, our community has created an incredibly deep knowledge base for stock traders. No one can ever exhaust every resource provided on our site.

If you are new, or just looking for guidance, here are some helpful links to get you started.

What are the benefits of VIP Membership?
VIP members get exclusive access to these proven and tested premium indicators: Buy the Dip, Advanced Market Moves 2.0, Take Profit, and Volatility Trading Range. In addition, VIP members get access to over 50 VIP-only custom indicators, add-ons, and strategies, private VIP-only forums, private Discord channel to discuss trades and strategies in real-time, customer support, trade alerts, and much more. Learn all about VIP membership here.
How can I access the premium indicators?
To access the premium indicators, which are plug and play ready, sign up for VIP membership here.
Back
Top