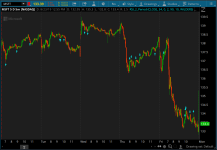
"Connors 2 Period RSI trading" refers to a trading strategy developed by Larry Connors that utilizes a very short-term Relative Strength Index (RSI) with a lookback period of just 2, aiming to capitalize on quick price reversals and mean reversion opportunities within a trend by identifying extremely overbought or oversold conditions on the market.
Key points about Connors 2 Period RSI trading:
- Short-term focus:
Due to the 2-period RSI setting, this strategy is designed for very short-term trading, often within a single trading session.
- Mean reversion principle:
The core idea is that after a sharp price movement, the market tends to revert back towards the average, providing potential entry points when the RSI reaches extreme levels.
- Buy signals:
Traders look for buy signals when the 2-period RSI dips below a very low level (like 10), indicating a possible oversold condition.
- Sell signals:
Conversely, sell signals are generated when the 2-period RSI spikes above a very high level (like 90), signifying potential overbought conditions.
- Market volatility:
This strategy is most effective in volatile markets where price swings occur frequently, allowing for quick entries and exits.
- Trend confirmation:
While the 2-period RSI can identify potential reversals, it's crucial to confirm the overall trend direction using other technical indicators or price action analysis to avoid false signals.
- Risk management:
Due to the aggressive nature of this strategy, strict risk management practices like stop-loss orders are essential to limit potential losses.
There are 4 steps to the strategy. Get it Here (Also an excellent resource for Technical Analysis: https://school.stockcharts.com/doku.php?id=trading_strategies:rsi2
Code:
# ConnorsRSI Indicator

declare lower;

input Price_RSI_Period = 3;
input Streak_RSI_Period = 2;
input Rank_Lookback = 100;
input OVER_BOUGHT = 90;
input OVER_SOLD = 10;
input SR_LENGTH = 35;
input PRICE = CLOSE;

# Component 1: the RSI of closing price
def priceRSI = reference RSI("price" = PRICE, "length" = Price_RSI_Period);

# Component 2: the RSI of the streak
def upDay = if PRICE > PRICE[1] then 1 else 0;
def downDay = if PRICE < PRICE[1] then -1 else 0;
def upStreak = if upDay != 0 then upStreak[1] + upDay else 0;
def downStreak = if downDay != 0 then downStreak[1] + downDay else 0;
def streak = upStreak + downStreak;
def streakRSI = reference RSI("price" = streak, "length" = Streak_RSI_Period);

# Componenet 3: The percent rank of the current return
def ROC1 = PRICE / PRICE[1] - 1;

def rank = fold i = 1 to Rank_Lookback + 1 with r = 0 do
r + (GetValue(ROC1, i, Rank_Lookback) < ROC1) ;

def pctRank = (rank / Rank_Lookback) * 100 ;

# The final ConnorsRSI calculation, combining the three components
plot ConnorsRSI = round((priceRSI + streakRSI + pctRank) / 3, NUMBEROFDIGITS = 0);

plot SR_HIGH = Round(Highest(ConnorsRSI, LENGTH = SR_LENGTH), NUMBEROFDIGITS = 0);

plot SR_LOW = Round(Lowest(ConnorsRSI, LENGTH = SR_LENGTH), NUMBEROFDIGITS = 0);

ConnorsRSI.AssignValueColor(if ConnorsRSI >= OVER_BOUGHT then Color.Red else if ConnorsRSI <= OVER_SOLD then Color.Green else Color.Gray);
ConnorsRSI.SetLineWeight(3);

SR_HIGH.SetDefaultColor(Color.CYAN);
SR_HIGH.SetLineWeight(1);

SR_LOW.SetDefaultColor(Color.CYAN);
SR_LOW.SetLineWeight(1);

plot OVERBOUGHT = OVER_BOUGHT;
OVERBOUGHT.SetDefaultColor(Color.DARK_GRAY);
OVERBOUGHT.Hide();
OVERBOUGHT.HideBubble();

plot OVERSOLD = OVER_SOLD;
OVERSOLD.SetDefaultColor(Color.DARK_GRAY);
OVERSOLD.Hide();
OVERSOLD.HideBubble();
Last edited by a moderator:


