Confirmation Candles Indicator For ThinkorSwim

Hi @METAL,
I currently use a 3 chart setup for the /es (although this could be used on other assets). C3_Max Day chart, TS_v9 15 min chart, PLD Bands 3 min chart. I look for the day chart and 15 min chart to be in agreement and make my entries and exits on the 3 min chart. This setup helps keep me out of choppy unprofitable trades. Currently I'm not leaving trades on overnight, and my strategy reflects more of a scalping style. However, I do enjoy swing trading the 30 min chart and holding trades overnight when market conditions are more favorable. Happy trading!
Thanks, I am using the c3Max on 5 different charts. 1m,3m,7m,10,30m. I am trying your setup as stated above and was wandering what exactly do you look to be in agreement on the 15m and D charts? Would you mind explaining or showing how you use the three together? If you have the time of course. Also, Curious as to why you wouldn't use the C3Max instead of the PLD and TS.
 
Last edited:

Join useThinkScript to post your question to a community of 21,000+ developers and traders.

Hi @Christopher84 ,
Is it possible to add just the blue PLD line to the Scalper_v3? My request comes after observing SPY + several stocks using both PLD and Scalper_v3 simultaneously. Both PLD and Scalper3 give great signals. I love PLD for being non-repainting, while Scalper3 gives many earlier signals than PLD (although Scalper3 repaints quite a lot as it should be). Having the PLD blue line in Scalper3 would greatly adds a layer of confirmation for its early-signals (plus of course the agreement of higher timeframes - I use 3min, 10min, 30min, 1hr in each grid). Thank you very much as always for your great works and for sharing them.
P.S. Also, I'm not sure if having PLD length 5 and Displace -5 is optimal for SPY and stocks such as TSLA, META, AAPL,...

eUgTLmo.png

NqlDT5t.png


L55uQmy.png
 
Last edited:
I have been using these in futures for paper trading to get familiar with /es, /nq.

With all the testing and back testing and overtrading and commissions and losses I did on my paper account for months, ever since I started using the zones for breakouts and stop losses, I was able to make all of the losses back to the point I’m scalping es in a 1 or 5 min chart 2-3 times a day.

My account was down $2k at one point before c3. It is now down $7.80.

This thing saved my life. Those auto generated real time zone painting is a HUGE game changer.

I made some adjustments to it and started adding signal arrows that show up when 7 of the indicstors are all bullish or bearish.

So not only do we get the parabolic sar arrow signals Chris made, but I am now getting conviction arrow indicstors when multiple indicators are on the same direction, the trend is getting stronger, and the volatility is rising.

If it is ok with Christopher, I can put up a version of my enhancement to this.

I didn’t remove any functionality, I just added ease of use and functionality.

I also don’t use pre market or after hours on my 5 min chart. MM manipulate them after hours to the point the charts can blow up on the open.

would love to see it
 
@Christopher84 Today i used the TS_V9 (I had it on the 15m chart and then changed it to the 5m to see how it worked). I think I may need to do some adjusting as I got a few false signals. Everything seemed to line up for buy and sells but they didn't work out. Let me know if you see anything wrong on my charts. BTW, I also had the PLD on the 3 min. Also, when you get te time, will you explain why you use the PLD and TS_V9 over the C3Max on all charts.

See charts:

kOS0Cew.jpg
iOhp66w.jpg
 

Attachments

  • kOS0Cew.jpg
    kOS0Cew.jpg
    291.5 KB · Views: 350
Last edited by a moderator:
Hi @Christopher84 ,
Is it possible to add just the blue PLD line to the Scalper_v3? My request comes after observing SPY + several stocks using both PLD and Scalper_v3 simultaneously. Both PLD and Scalper3 give great signals. I love PLD for being non-repainting, while Scalper3 gives many earlier signals than PLD (although Scalper3 repaints quite a lot as it should be). Having the PLD blue line in Scalper3 would greatly adds a layer of confirmation for its early-signals (plus of course the agreement of higher timeframes - I use 3min, 10min, 30min, 1hr in each grid). Thank you very much as always for your great works and for sharing them.
P.S. Also, I'm not sure if having PLD length 5 and Displace -5 is optimal for SPY and stocks such as TSLA, META, AAPL,...

eUgTLmo.png

NqlDT5t.png


L55uQmy.png
Hey Eagle, Are you using the C3Max and scalper_V3 on the same chart? If not, how did you get the all of the same indicators as the C3Max?
 
@Christopher84 Just an FYI, I was just testing the Scalper_V3 and I get an error while using Heikin Ashi candles. It say the Fibonacci pattern search isn't available with modified candle and to use standard chart. Can this be fixed or is it an internal issue?
 
The green arrows are from today 10:30 AM market time. ES opened on a gap down and broke lit. It’s not perfect and I have to add bollinger bands to it, but it’s a start.

As long as price action follows the trend, the arrows keep going up, higher highs and lows form, and especially if you see this action exiting a zone, it’s good to go.

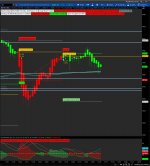
I caught this entire move.

Tge green rectangle is the demand zone. Th price broke out and pulled back. I waited for the pullback.

Then the blue arrow showed up. That’s the parabolic sar crossover signal Chris put in showing possible direction to upside.

Then my arrows showed up. At that point I took a long position and watched to ensure the price stayed above a bollinger band and kept watching the green arrows follow the price.

As you can see, between the signal Chris did, the arrows showing up, the price riding a few sma lines and bollinger bands it went up until a supply was formed at the top. At that point the arrows disappeared which means one indicator is not in alignment with the others.

I entered 3972 and closed out 4000

JIWUlXF.jpg


What I tend to do is enter long when a stock breaks out of supply/demand resistance, or short when it breaks supportand set a stop loss on the other side of the zone. It helps mitigate a loss in a fakeout and retrace.

I’ve gotten faked out a few times, even with the arrows, but what usually happens is when I enter long, and I see one arrow, then another, and another for a few consecutive candles, odds are good.

But if I enter long and I see arrows appear and disappear sporadically, it usually means chop action. I’ll either close out and reposition or sset a tight stop loss and leave it alone for the day.

I have downside arrows as well

I also use the confirmation candles Chris wrote, mainly for interim support and resistance. There are times where a stock is between zones on the c3 max but a stock never reaches a zone. It is because it hit a resistance or support between zones at the time and the new zones will be drawn out later

This happened between Tuesday and Wednesday. On Tuesday there was a supply at 3980 but es never reached it. The confirmation candle resistance was at 3938 or so.

The next day c3 max drew out Tge new supply at 11:15 or so. Once that previous day resistance was broken, it continued up

i warned you all... This is a TON of information. But unfortunately, this is really the only way to get good at day trading. It's being able to absorb information quickly. That is why I am paper trading. I didnt know any of this last year and I got stick of losing money. Plus I was involved in OTC at the time... never again.

the arrows work off the macd, rsi, mfi, short and long term ttm wave, ttm squeeze, adx, and on balance volume. When all of those are either above 0 or above 50 for rsi/mfi, the arrows show up.

When they are all below 0 or below 50 the red downside arrows show up
the grey boxes are other consolidation indicators that work in conjunction with the zones from c3max

you can see on the right the supply zone was at 3970 or so, but the price never broke out of the grey box (another consolidation).

the c3max eventually drew another supply zone the next day right where the grey box ended from the day before. at that point that was a major resistance (2 different indicators showing the same consolidation and supply resistance). once it broke out of both boxes i took a long position with a stop loss below the new supply zone support.

right before my entry, which is the first green candle peeking out the right side supply, there was an aqua parabolic sar crossover, stating a possible move upward.

after i entered the price started moving, then i saw the green arrows show up over and over again. at that point I knew it was going to run and my stop loss wasnt going to trigger.

next thing, the vwap (purple avy line), the sma 5 red, 21 blue, 50 yellow, all started curving up, then the 200 green sma followed, and the confirmation candle resistances (left side with the green dots), started creating an upward channel, and it ran for almost 30 points in 45 minutes.

the indicator on the bottom left is a smooth heiken ashi, which i found in usethinkscript forums. it smooths out the choppy noise. green boxes that curve up or get wider means the avg heiken ashi price is slowing becoming bullish.

you can see right at the breakout, all my indicators on every single study were all going up or reversing from bearish to bullish.

the blue ttm wave histograms are very good at detecting consolidation and compression as well. dark blue means the stock is compressing (accumulating at a certain price level. Light blue means expansion (price will be moving).

when you see the histograms below the zero line and start to creep up, that mean a possible reversal to upside is pending. Thus, when looking at the ttm wave, you see how it was dark blue and below zero, but the histograms were slowly creeping back up to zero with dark blue. that means a bearish downtrend may be ending and the stock is being bought up by bulls at a certain range.

then the histogram eventaully went above the zero line, and eventually turned light blue. the fact it was above the zero line means a bullish trend may be coming and the fact it went from dark blue (consolidation) to light blue (expansion) means the price is about to move.

histogram above zero = bullish. dark blue to light blue means compression is over.

this happened on 09-07 12:40 PM market time on the 5 min chart. and that is EXACTLY where the breakout happened on the supply zone and exactly where i entered. then it turned dark blue again at 4 PM right at the close. As a general rule I will not hold a position past 3:30 PM EST regardless of chart.

then on the open today was a gap down, dark blue histograms but still above zero. dark blue = consolidation above zero means bullish. and what happened... people bought the gap down dip at thew open today.

then at 10:15 AM market time it turns light blue. what happened 15 minutes later... stock broke out of a supply zone from c3 max and it jsut ran... i entered on that breakout and sold at soon as i started seeing one of the indicators fall (macd, ttm squeeze, short term ttm wave which is the yellow and burgundy, it didnt matter). as soon as i saw macd fade, then ttm squeeze fade, then the ttm wave short term turn from yellow to burgundy (same principle as light blue and dark blue on long term), then price broke belw the 5 period sma... i closed out.

that was at 11:35 AM market time today. 25 minutes later at noon, ES took a big dice from 3995 to 3975. i closed out at 4000 before the crash
sgQgLqx.jpg
ULEvNnE.png


I entered a short mes position in paper trade at 7:54 AM market time on 09-09-2022 4037. Using the c3 max 15 min chart, and the extended hours chart on, see if anyone can figure out why I entered and where my stop loss is.

Reply back.


Now from there if my intention was to hold it, I wouldn’t use the arrows for anything past a 1 hour timeframe.

ES is now at 4041. Had I wanted to swing it, my 3972 entrt woudl have been golden bc I entered on a day trade right where the hourly demand is… perfect bottom entry for a swing trade IMO

got stopped out at 4046. switched to a long position at 10:01:42. double heavy compared to my short loss. sold at 10:05:05 market time at 4051. turned a red trade to a green net gain.


im in long 4060 to ride a trend..

closed it out. i smell a fake breakout. 5 min chart is fading. RSI overbought, MACD fading, MFI is not making higher highs, ttm squeeze going from light blue upper movement to dark blue down movement, ttm wave short term going down and burgundy, volume dying out, supply zone here. i smell a breakdown.

i may be wrong on closing out but i took the 2 point scalp from 4060 to 4062. something about this doesnt feel right to me. not enough conviction for me to give profits back

last trade. took a short position

last trade. took a short position
sorryi had 2 contracts. i bought one to cover at the 21 period SMA on the 5 min chart. holding the other

added to my short position again 12:08:05 4048.25


gave back profits. i dont like the price action.did the add on the 1 min chart (against my rules). paid the price for it. lesson learned... dont use the 1 min chart and stick to your rules.

i always get faked out on the 1 min chart

I recovered. bought the breakout of 4064.25 at 13:30 market time. 5 contracts long in es for 4063.25
closed for 4066.

net gain green for the day $412.50. Profit YTD $750 doing nothing but scalping while working full time

too bad im broke in my OTC garbage account and I wont sell for a loss so Im stuck
 
Last edited by a moderator:
@Christopher84 Just an FYI, I was just testing the Scalper_V3 and I get an error while using Heikin Ashi candles. It say the Fibonacci pattern search isn't available with modified candle and to use standard chart. Can this be fixed or is it an internal issue?
Hi @METAL,
I tried to replicate the issue that you were having, but it seems to work alright for me (see below). I'm sorry, but I'm unsure what the issue is.
T3nxIqY.png
 
Hopefully you will explain why you use this setup over your C3Max. I would really like to know what you are seeing. Do you only buy if the Floating_PL is green if you get the other confirmations?
Hi @METAL,
I definitely still use C3_Max (it's what is currently on my Day chart). I could use it on every timeframe and it would perform well. The reason I like using different strategies, is because I'm always testing new ideas, and I like to see when different strategies work together, Scalper v3 is another one that I love to watch on lower timeframes. The main idea is to look for agreement between the successful strategies.
 
Hi @METAL,
I tried to replicate the issue that you were having, but it seems to work alright for me (see below). I'm sorry, but I'm unsure what the issue is.
T3nxIqY.png
Hmm. Mine does not look like that. Do you mind sharing your settings? I did change the Mult. to 1 as you suggested.
Hi @METAL,
I definitely still use C3_Max (it's what is currently on my Day chart). I could use it on every timeframe and it would perform well. The reason I like using different strategies, is because I'm always testing new ideas, and I like to see when different strategies work together, Scalper v3 is another one that I love to watch on lower timeframes. The main idea is to look for agreement between the successful strategies.
Okay. Gotcha. I was curious if you had found an higher percentage winning by using the three different strats. I tried them today and it was okay for me. I still relied on the C3Max on the 3m. Not sure if that is its best timeframe for scalping but still working on it. What exactly does the yellow candle mean on these strats? I think someone had said it is maybe the beginning of a reversal but I have had every chart today with yellow candles go all the way up. The entire move up was yellow candles.
 
Hi @Christopher84 do you mind sharing your latest setup with the C3_Max, Scalper v3 and whatever other indicator that you felt paired well together? Thanks in advance!

I only ask for your most current setup because my Scalper V3 doesn't look like yours either same as @METAL had said:


Last edited by a moderator:
Hmm. Mine does not look like that. Do you mind sharing your settings? I did change the Mult. to 1 as you suggested.

Okay. Gotcha. I was curious if you had found an higher percentage winning by using the three different strats. I tried them today and it was okay for me. I still relied on the C3Max on the 3m. Not sure if that is its best timeframe for scalping but still working on it. What exactly does the yellow candle mean on these strats? I think someone had said it is maybe the beginning of a reversal but I have had every chart today with yellow candles go all the way up. The entire move up was yellow candles.
Hi @METAL,
On specifically the strategies, the yellow candles will occur when the profit on the position is in the top 75% of the strategies previous performance. This can serve as an indication to take profits on your position. Hope that helps a bit!
 
Hi @METAL,
On specifically the strategies, the yellow candles will occur when the profit on the position is in the top 75% of the strategies previous performance. This can serve as an indication to take profits on your position. Hope that helps a bit!
Okay. I kind of thought that but when I had a few different stocks stay yellow all the way up, I second guessed the reason for yellow. I know you are pretty busy answering question and if you get the time, would you provide what your most successful use of your strategies. Thanks again for sharing your hard work and expertise. I and I am sure most of the forum greatly appreciates all you do.
 
Okay. I kind of thought that but when I had a few different stocks stay yellow all the way up, I second guessed the reason for yellow. I know you are pretty busy answering question and if you get the time, would you provide what your most successful use of your strategies. Thanks again for sharing your hard work and expertise. I and I am sure most of the forum greatly appreciates all you do.
Thank you @METAL! Something worth noting, is to make sure you are using the longest chart history available for whatever timeframe you are on. It will make the yellow candles considerably more accurate.
 

Not the exact question you're looking for?

Start a new thread and receive assistance from our community.

87k+ Posts
412 Online
Create Post

The Market Trading Game Changer

Join 2,500+ subscribers inside the useThinkScript VIP Membership Club
  • Exclusive indicators
  • Proven strategies & setups
  • Private Discord community
  • ‘Buy The Dip’ signal alerts
  • Exclusive members-only content
  • Add-ons and resources
  • 1 full year of unlimited support

Frequently Asked Questions

What is useThinkScript?

useThinkScript is the #1 community of stock market investors using indicators and other tools to power their trading strategies. Traders of all skill levels use our forums to learn about scripting and indicators, help each other, and discover new ways to gain an edge in the markets.

How do I get started?

We get it. Our forum can be intimidating, if not overwhelming. With thousands of topics, tens of thousands of posts, our community has created an incredibly deep knowledge base for stock traders. No one can ever exhaust every resource provided on our site.

If you are new, or just looking for guidance, here are some helpful links to get you started.

What are the benefits of VIP Membership?
VIP members get exclusive access to these proven and tested premium indicators: Buy the Dip, Advanced Market Moves 2.0, Take Profit, and Volatility Trading Range. In addition, VIP members get access to over 50 VIP-only custom indicators, add-ons, and strategies, private VIP-only forums, private Discord channel to discuss trades and strategies in real-time, customer support, trade alerts, and much more. Learn all about VIP membership here.
How can I access the premium indicators?
To access the premium indicators, which are plug and play ready, sign up for VIP membership here.
Back
Top