@Christopher84 thank you yet again for an awesome update, Havent been on the forum for a while and just saw the update and installed it and have been backtesting as much as I can. A few questions
1. Doing a bit of backtesting, i am finding the 15 minute chart seems to throw the least false positives for day trading (tried 10 minutes, 5 and 3 and I kept on getting fooled thinking the trend was turning negative when it was just a short term pullback). That said, I am also looking at how I can adapt this to longer term swings (when the market stop beings so volatile) and while the 1H trend works, was wondering if you had any success with longer time frames. I know you mentioned 4H in one of your comments but wanted to check and see how you found the overall reliablity.
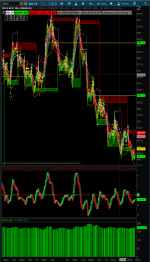
2 I was backtesting the C3 Max line and the relationship to the EMA cloud and I found that when the line is above the cloud and green, Going Long works well but when the line turns red and goes below the ema cloud, thens puts work best. That said, I have noticed that sometimes the line turns red but stays in the cloud and reverts back to green soon,how do you handle those scenarios. I am thinking a combination of two timeframes (5 and 15Minute) might help avert some false negatives but I would love to hear your input on this. Also would it be possible to get a scan of when C3 Max line is below the cloud or above the cloud ( I am guessing No but was just wondering since that would seriously help scope down the stocks to look at)
3. I am trying to best understand how to use the red and green resistance\support zones. I understand the tops and bottoms of these zones serve as resistance\support but do you often find that if the bottom or top line is broken, the price usually rises to the top of the red zone or continues to fall to the bottom of the green zone. Looking at the charts, seems like that happens a lot but I am just trying to figure out if the price breaks past my target level, should I move my target levels again to the top or bottom as the need maybe.
Reading through the comments, i saw that you had to spend time in the hospital, hope you are much better now.

")