G
guest
Guest
Hey @Christopher84!
I found one of your previous confirmation candle scripts here:
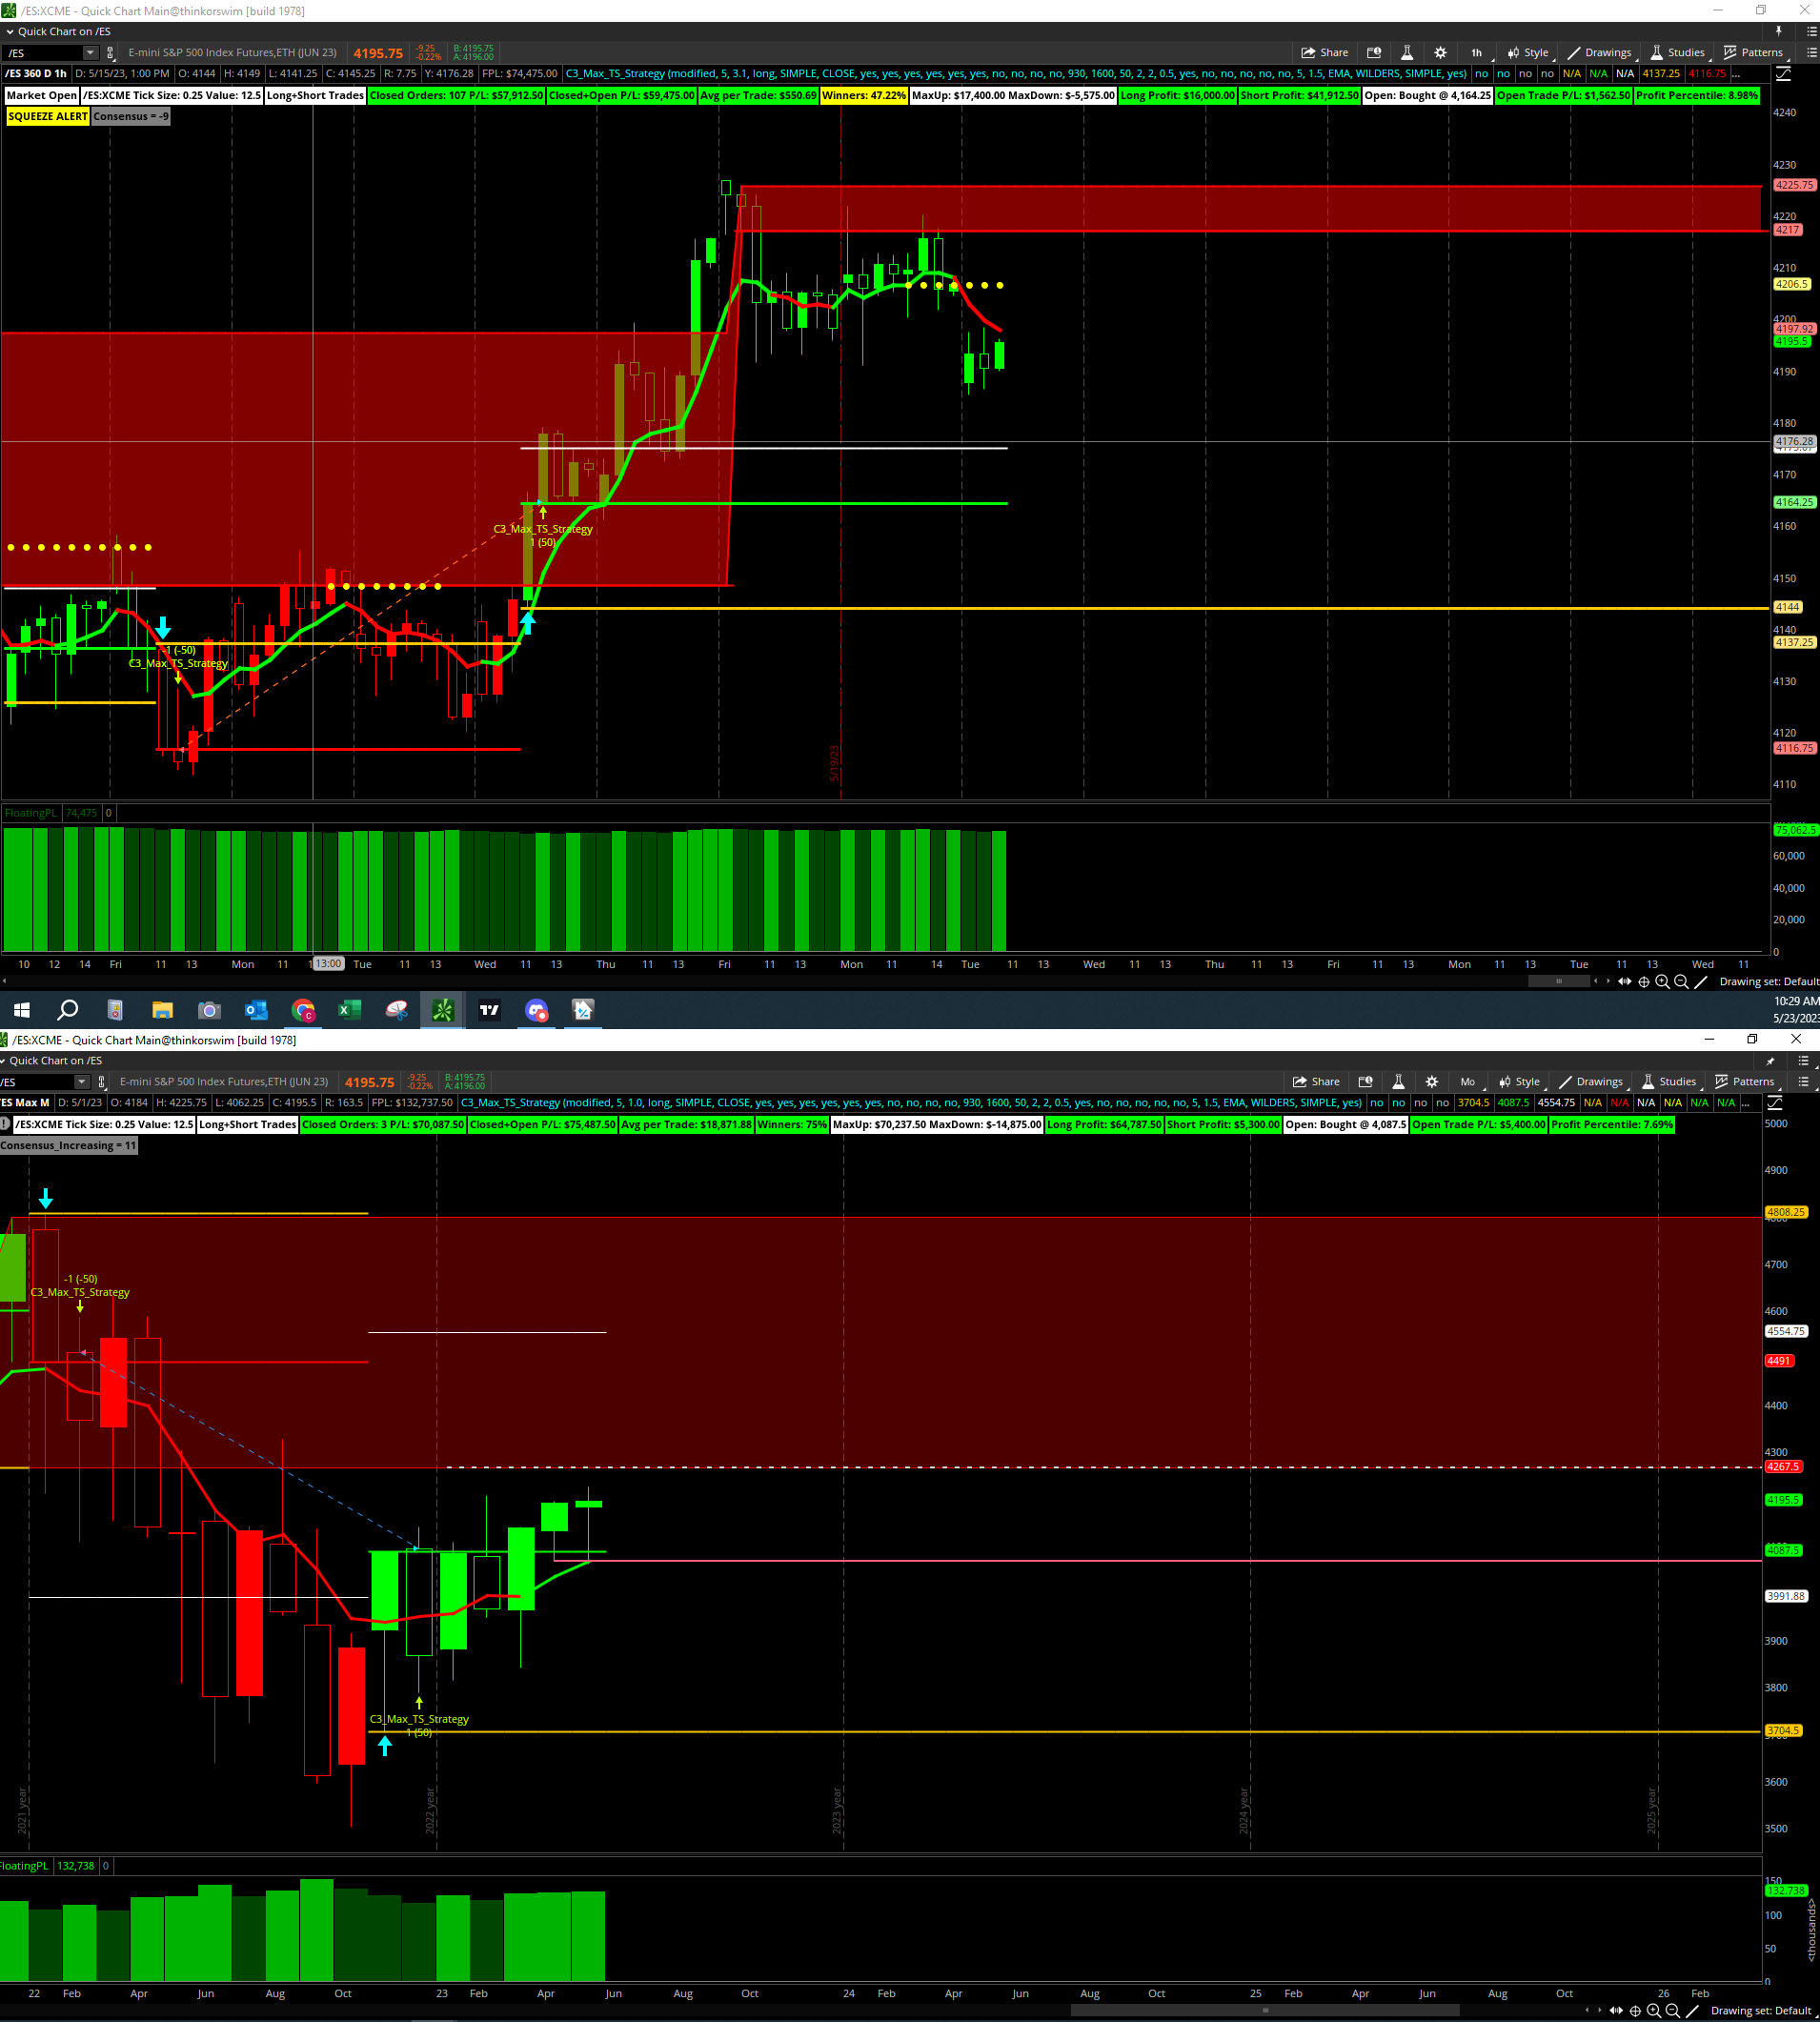
Looks interesting on overbought and oversold zones on a 5 minute and 1 minute chart.
Are you still using this. What do the large and smaller arrows represent and also wanted to know if it repaints?
#Confirmation Candles developed 04/15/2021 by Christopher Wilson
#Select the level of agreement among the 13 indicators included.
#MACD with Price
declare upper;
def price = close;
def fastLength = 12;
def slowLength = 26;
def MACDLength = 9;
input MACD_AverageType = {SMA, default EMA};
def MACDLevel = 0.0;
def fastEMA = ExpAverage(price, fastLength);
def slowEMA = ExpAverage(price, slowLength);
def Value;
def Avg;
switch (MACD_AverageType) {
case SMA:
Value = Average(price, fastLength) - Average(price, slowLength);
Avg = Average(Value, MACDLength);
case EMA:
Value = fastEMA - slowEMA;
Avg = ExpAverage(Value, MACDLength);}
def Diff = Value - Avg;
def Level = MACDLevel;
def condition1 = Value >= MACDLevel;
#RSI
input RSI_length = 14;
input RSI_AverageType = AverageType.WILDERS;
def NetChgAvg = MovingAverage(RSI_AverageType, price - price[1], RSI_length);
def TotChgAvg = MovingAverage(RSI_AverageType, AbsValue(price - price[1]), RSI_length);
def ChgRatio = if TotChgAvg != 0 then NetChgAvg / TotChgAvg else 0;
def RSI = 50 * (ChgRatio + 1);
def condition2 = RSI >= 50;
#MFI
input MFI_Length = 14;
def MFIover_Sold = 20;
def MFIover_Bought = 80;
def movingAvgLength = 1;
def MoneyFlowIndex = Average(moneyflow(high, close, low, volume, MFI_Length), movingAvgLength);
def MFIOverBought = MFIover_Bought;
def MFIOverSold = MFIover_Sold;
def condition3 = MoneyFlowIndex > 50;
#Intermediate Forecast
def na = Double.NaN;
def MidLine = 50;
def Momentum = MarketForecast().Momentum;
def NearT = MarketForecast().NearTerm;
def Intermed = MarketForecast().Intermediate;
def OB = 80;
def OS = 20;
def upperLine = 110;
def condition4 = Intermed[3] <= Intermed;
#Nearterm Forecast
def condition5 = NearT >= MidLine;
#VWAP_Pivot Signals
def n = 20;
def ticks = 2.0;
def bnOK = barNumber() > n;
def isHigher = fold i = 1 to n + 1 with p = 1 while p do high > GetValue(high, -i);
def HH = if bnOK and isHigher and high == Highest(high, n)then high else Double.NaN;
def isLower = fold j = 1 to n + 1 with q = 1 while q do low < GetValue(low, -j);
def LL = if bnOK and isLower and low == Lowest(low, n) then low else Double.NaN;
def PivH = if HH > 0 then HH else Double.NaN;
def PivL = if LL > 0 then LL else Double.NaN;
plot UpPivotLow = !isNaN(PivL);
UpPivotLow.SetPaintingStrategy(PaintingStrategy.BOOLEAN_ARROW_UP);
UpPivotLow.SetLineWeight(3);
UpPivotLow.SetDefaultColor(Color.GREEN);
plot DownPivotHigh = !isNaN(PivH);
DownPivotHigh.SetPaintingStrategy(PaintingStrategy.BOOLEAN_ARROW_DOWN);
DownPivotHigh.SetLineWeight(3);
DownPivotHigh.SetDefaultColor(Color.RED);
def condition6 = !isNaN(PivL);
#EMA_1
input EMA_length = 20;
def displace = 0;
def AvgExp = ExpAverage(price[-displace], EMA_length);
def condition7 = price >= AvgExp;
#EMA_2
input EMA_2length = 50;
def displace2 = 0;
def AvgExp2 = ExpAverage(price[-displace2], EMA_2length);
def condition8 = price >= AvgExp2;
#DMI Oscillator
input DMI_length = 10;
input DMI_averageType = AverageType.WILDERS;
def diPlus = DMI(DMI_length, DMI_averageType)."DI+";
def diMinus = DMI(DMI_length, DMI_averageType)."DI-";
def Osc = diPlus - diMinus;
def Hist = Osc;
def ZeroLine = 0;
def condition9 = Osc > ZeroLine;
#Trend_Periods
input TP_fastLength = 7;
input TP_slowLength = 15;
def Periods = sign(ExpAverage(close, TP_fastLength) - ExpAverage(close, TP_slowLength));
def condition10 = Periods > 0;
#Polarized Fractal Efficiency
input PFE_length = 10;
input smoothingLength = 5;
def PFE_diff = close - close[PFE_length - 1];
def val = 100 * Sqrt(Sqr(PFE_diff) + Sqr(PFE_length)) / sum(Sqrt(1 + Sqr(close - close[1])), PFE_length - 1);
def PFE = ExpAverage(if PFE_diff > 0 then val else -val, smoothingLength);
def UpperLevel = 50;
def LowerLevel = -50;
def condition11 = PFE > ZERoLine;
#Bollinger Bands PercentB
input BBPB_averageType = AverageType.Simple;
input BBPB_length = 20;
def Num_Dev_Dn = -2.0;
def Num_Dev_up = 2.0;
def upperBand = BollingerBands(price, displace, BBPB_length, Num_Dev_Dn, Num_Dev_up, BBPB_averageType).UpperBand;
def lowerBand = BollingerBands(price, displace, BBPB_length, Num_Dev_Dn, Num_Dev_up, BBPB_averageType).LowerBand;
def PercentB = (price - lowerBand) / (upperBand - lowerBand) * 100;
def HalfLine = 50;
def UnitLine = 100;
def condition12 = PercentB > 50;
#Chaikin Oscillator
input ChaikinOsc_longLength = 10;
input ChaikinOsc_shortLength = 3;
def accDist = AccDist();
def COSC = ExpAverage(accDist, ChaikinOsc_shortLength) - ExpAverage(accDist, ChaikinOsc_longLength);
def condition13 = COSC > zeroline;
#Trend Confirmation
#Confirmation_Factor range 1-13.
input Confirmation_Factor = 6;
#Use for testing conditions individually. Remove # from line below and chang Confirmation_Factor to 1.
#def Agreement_Level = condition1;
def Agreement_Level = condition1 + condition2 + condition3 + condition4 + condition5 + condition6 + condition7 + condition8 + condition9 + condition10 + condition11 + condition12 + condition13;
input coloredCandlesOn = yes;
def UP = Agreement_Level >= Confirmation_Factor;
def DOWN = Agreement_Level < Confirmation_Factor;
AssignPriceColor(if coloredCandlesOn and UP then Color.LIGHT_GREEN else if coloredCandlesOn and DOWN then Color.RED else Color.YELLOW);
#Additional Signals
plot UPSignal = Agreement_Level crosses above Confirmation_Factor;
UPSignal.SetPaintingStrategy(PaintingStrategy.BOOLEAN_ARROW_UP);
UPSignal.SetLineWeight(1);
UPSignal.SetDefaultColor(Color.green);
plot DOWNSignal = Agreement_Level crosses below Confirmation_Factor;
DOWNSignal.SetPaintingStrategy(PaintingStrategy.BOOLEAN_ARROW_DOWN);
DOWNSignal.SetLineWeight(1);
DOWNSIGNAL.SetDefaultColor(Color.red);
I found one of your previous confirmation candle scripts here:
Looks interesting on overbought and oversold zones on a 5 minute and 1 minute chart.
Are you still using this. What do the large and smaller arrows represent and also wanted to know if it repaints?
#Confirmation Candles developed 04/15/2021 by Christopher Wilson
#Select the level of agreement among the 13 indicators included.
#MACD with Price
declare upper;
def price = close;
def fastLength = 12;
def slowLength = 26;
def MACDLength = 9;
input MACD_AverageType = {SMA, default EMA};
def MACDLevel = 0.0;
def fastEMA = ExpAverage(price, fastLength);
def slowEMA = ExpAverage(price, slowLength);
def Value;
def Avg;
switch (MACD_AverageType) {
case SMA:
Value = Average(price, fastLength) - Average(price, slowLength);
Avg = Average(Value, MACDLength);
case EMA:
Value = fastEMA - slowEMA;
Avg = ExpAverage(Value, MACDLength);}
def Diff = Value - Avg;
def Level = MACDLevel;
def condition1 = Value >= MACDLevel;
#RSI
input RSI_length = 14;
input RSI_AverageType = AverageType.WILDERS;
def NetChgAvg = MovingAverage(RSI_AverageType, price - price[1], RSI_length);
def TotChgAvg = MovingAverage(RSI_AverageType, AbsValue(price - price[1]), RSI_length);
def ChgRatio = if TotChgAvg != 0 then NetChgAvg / TotChgAvg else 0;
def RSI = 50 * (ChgRatio + 1);
def condition2 = RSI >= 50;
#MFI
input MFI_Length = 14;
def MFIover_Sold = 20;
def MFIover_Bought = 80;
def movingAvgLength = 1;
def MoneyFlowIndex = Average(moneyflow(high, close, low, volume, MFI_Length), movingAvgLength);
def MFIOverBought = MFIover_Bought;
def MFIOverSold = MFIover_Sold;
def condition3 = MoneyFlowIndex > 50;
#Intermediate Forecast
def na = Double.NaN;
def MidLine = 50;
def Momentum = MarketForecast().Momentum;
def NearT = MarketForecast().NearTerm;
def Intermed = MarketForecast().Intermediate;
def OB = 80;
def OS = 20;
def upperLine = 110;
def condition4 = Intermed[3] <= Intermed;
#Nearterm Forecast
def condition5 = NearT >= MidLine;
#VWAP_Pivot Signals
def n = 20;
def ticks = 2.0;
def bnOK = barNumber() > n;
def isHigher = fold i = 1 to n + 1 with p = 1 while p do high > GetValue(high, -i);
def HH = if bnOK and isHigher and high == Highest(high, n)then high else Double.NaN;
def isLower = fold j = 1 to n + 1 with q = 1 while q do low < GetValue(low, -j);
def LL = if bnOK and isLower and low == Lowest(low, n) then low else Double.NaN;
def PivH = if HH > 0 then HH else Double.NaN;
def PivL = if LL > 0 then LL else Double.NaN;
plot UpPivotLow = !isNaN(PivL);
UpPivotLow.SetPaintingStrategy(PaintingStrategy.BOOLEAN_ARROW_UP);
UpPivotLow.SetLineWeight(3);
UpPivotLow.SetDefaultColor(Color.GREEN);
plot DownPivotHigh = !isNaN(PivH);
DownPivotHigh.SetPaintingStrategy(PaintingStrategy.BOOLEAN_ARROW_DOWN);
DownPivotHigh.SetLineWeight(3);
DownPivotHigh.SetDefaultColor(Color.RED);
def condition6 = !isNaN(PivL);
#EMA_1
input EMA_length = 20;
def displace = 0;
def AvgExp = ExpAverage(price[-displace], EMA_length);
def condition7 = price >= AvgExp;
#EMA_2
input EMA_2length = 50;
def displace2 = 0;
def AvgExp2 = ExpAverage(price[-displace2], EMA_2length);
def condition8 = price >= AvgExp2;
#DMI Oscillator
input DMI_length = 10;
input DMI_averageType = AverageType.WILDERS;
def diPlus = DMI(DMI_length, DMI_averageType)."DI+";
def diMinus = DMI(DMI_length, DMI_averageType)."DI-";
def Osc = diPlus - diMinus;
def Hist = Osc;
def ZeroLine = 0;
def condition9 = Osc > ZeroLine;
#Trend_Periods
input TP_fastLength = 7;
input TP_slowLength = 15;
def Periods = sign(ExpAverage(close, TP_fastLength) - ExpAverage(close, TP_slowLength));
def condition10 = Periods > 0;
#Polarized Fractal Efficiency
input PFE_length = 10;
input smoothingLength = 5;
def PFE_diff = close - close[PFE_length - 1];
def val = 100 * Sqrt(Sqr(PFE_diff) + Sqr(PFE_length)) / sum(Sqrt(1 + Sqr(close - close[1])), PFE_length - 1);
def PFE = ExpAverage(if PFE_diff > 0 then val else -val, smoothingLength);
def UpperLevel = 50;
def LowerLevel = -50;
def condition11 = PFE > ZERoLine;
#Bollinger Bands PercentB
input BBPB_averageType = AverageType.Simple;
input BBPB_length = 20;
def Num_Dev_Dn = -2.0;
def Num_Dev_up = 2.0;
def upperBand = BollingerBands(price, displace, BBPB_length, Num_Dev_Dn, Num_Dev_up, BBPB_averageType).UpperBand;
def lowerBand = BollingerBands(price, displace, BBPB_length, Num_Dev_Dn, Num_Dev_up, BBPB_averageType).LowerBand;
def PercentB = (price - lowerBand) / (upperBand - lowerBand) * 100;
def HalfLine = 50;
def UnitLine = 100;
def condition12 = PercentB > 50;
#Chaikin Oscillator
input ChaikinOsc_longLength = 10;
input ChaikinOsc_shortLength = 3;
def accDist = AccDist();
def COSC = ExpAverage(accDist, ChaikinOsc_shortLength) - ExpAverage(accDist, ChaikinOsc_longLength);
def condition13 = COSC > zeroline;
#Trend Confirmation
#Confirmation_Factor range 1-13.
input Confirmation_Factor = 6;
#Use for testing conditions individually. Remove # from line below and chang Confirmation_Factor to 1.
#def Agreement_Level = condition1;
def Agreement_Level = condition1 + condition2 + condition3 + condition4 + condition5 + condition6 + condition7 + condition8 + condition9 + condition10 + condition11 + condition12 + condition13;
input coloredCandlesOn = yes;
def UP = Agreement_Level >= Confirmation_Factor;
def DOWN = Agreement_Level < Confirmation_Factor;
AssignPriceColor(if coloredCandlesOn and UP then Color.LIGHT_GREEN else if coloredCandlesOn and DOWN then Color.RED else Color.YELLOW);
#Additional Signals
plot UPSignal = Agreement_Level crosses above Confirmation_Factor;
UPSignal.SetPaintingStrategy(PaintingStrategy.BOOLEAN_ARROW_UP);
UPSignal.SetLineWeight(1);
UPSignal.SetDefaultColor(Color.green);
plot DOWNSignal = Agreement_Level crosses below Confirmation_Factor;
DOWNSignal.SetPaintingStrategy(PaintingStrategy.BOOLEAN_ARROW_DOWN);
DOWNSignal.SetLineWeight(1);
DOWNSIGNAL.SetDefaultColor(Color.red);