can we show/print the bar body length somewhere on the chart

oldyoungguy

New member
VIP
I am using Heikin Ashi bar. I am trying to figure out how the bar body line length is determined on the chart. So that the charts' look and feel are similar for different price stocks. Is there a way to show/print out each bar's body length (calculated length, or the actual line length) on the chart? I know how to calculate the body length but I don't know how to show/print them. If you know the actual code TOS use them to draw the bar, please let me know where to find them. Then I will not need this experimental step.
 
Solution
I tested the code. It seems it is not for Heikin Ashi chart.
My code

def baseTF_barLen1 = baseTF_isGreen && BodyHeight() < 1 && BodyHeight() > 0.01;
def baseTF_barLenSmall = baseTF_isGreen && BodyHeight() <= 0.01;

baseTF_barLenSmall
is red arrow.

I need the length of the body part not including the top and bottom wicks.

320Q5W9.jpg
Here is heiken ashi line and value for body

Ruby:
def o = open;
def h = high;
def l = low;
def c = close;

def HAclose = ohlc4;
def HAopen = CompoundValue(1, (HAopen[1] + HAclose[1]) / 2, (o[1] + c[1]) / 2);
def haopen_ = HAopen;
def HAhigh = if HAopen > HAclose then Max(Max(h, HAopen), HAclose) else Double.NaN;
def HAlow = if HAopen > HAclose then Min(Min(l, HAopen), HAclose)...
I am using Heikin Ashi bar. I am trying to figure out how the bar body line length is determined on the chart. So that the charts' look and feel are similar for different price stocks. Is there a way to show/print out each bar's body length (calculated length, or the actual line length) on the chart? I know how to calculate the body length but I don't know how to show/print them. If you know the actual code TOS use them to draw the bar, please let me know where to find them. Then I will not need this experimental step.

The bodyheight() function is defined as the absolute value of open-close on a candle/bar.

Here is code that displays the body height as a vertical line on each bar. Also, is a plot of lines connecting the top and bottom of each bar. This appears to be the same regardless of the charttype on time or range charts.

The image is a heiken ashi candle but shows the bodyheight for the candle/bar.
Capture.jpg
Code:
AddChart(max(open,close), min(open,close), 0, 0, ChartType.bar, growColor = Color.WHITE);

plot CandleBodyTop = MidBodyVal() + 0.5 * BodyHeight();
plot CandleBodyBottom = MidBodyVal() - 0.5 * BodyHeight();
 
I tested the code. It seems it is not for Heikin Ashi chart.
My code

def baseTF_barLen1 = baseTF_isGreen && BodyHeight() < 1 && BodyHeight() > 0.01;
def baseTF_barLenSmall = baseTF_isGreen && BodyHeight() <= 0.01;

baseTF_barLenSmall
is red arrow.

I need the length of the body part not including the top and bottom wicks.

320Q5W9.jpg
Here is heiken ashi line and value for body

Ruby:
def o = open;
def h = high;
def l = low;
def c = close;

def HAclose = ohlc4;
def HAopen = CompoundValue(1, (HAopen[1] + HAclose[1]) / 2, (o[1] + c[1]) / 2);
def haopen_ = HAopen;
def HAhigh = if HAopen > HAclose then Max(Max(h, HAopen), HAclose) else Double.NaN;
def HAlow = if HAopen > HAclose then Min(Min(l, HAopen), HAclose) else Double.NaN;

AddChart(Max(haopen_, HAclose), Min(haopen_, HAclose), 0, 0, ChartType.BAR, growColor = Color.WHITE);

input showbubble = yes;
AddChartBubble(showbubble, low, Round(AbsValue(HAopen - HAclose), 3), Color.WHITE, no);
 
Solution
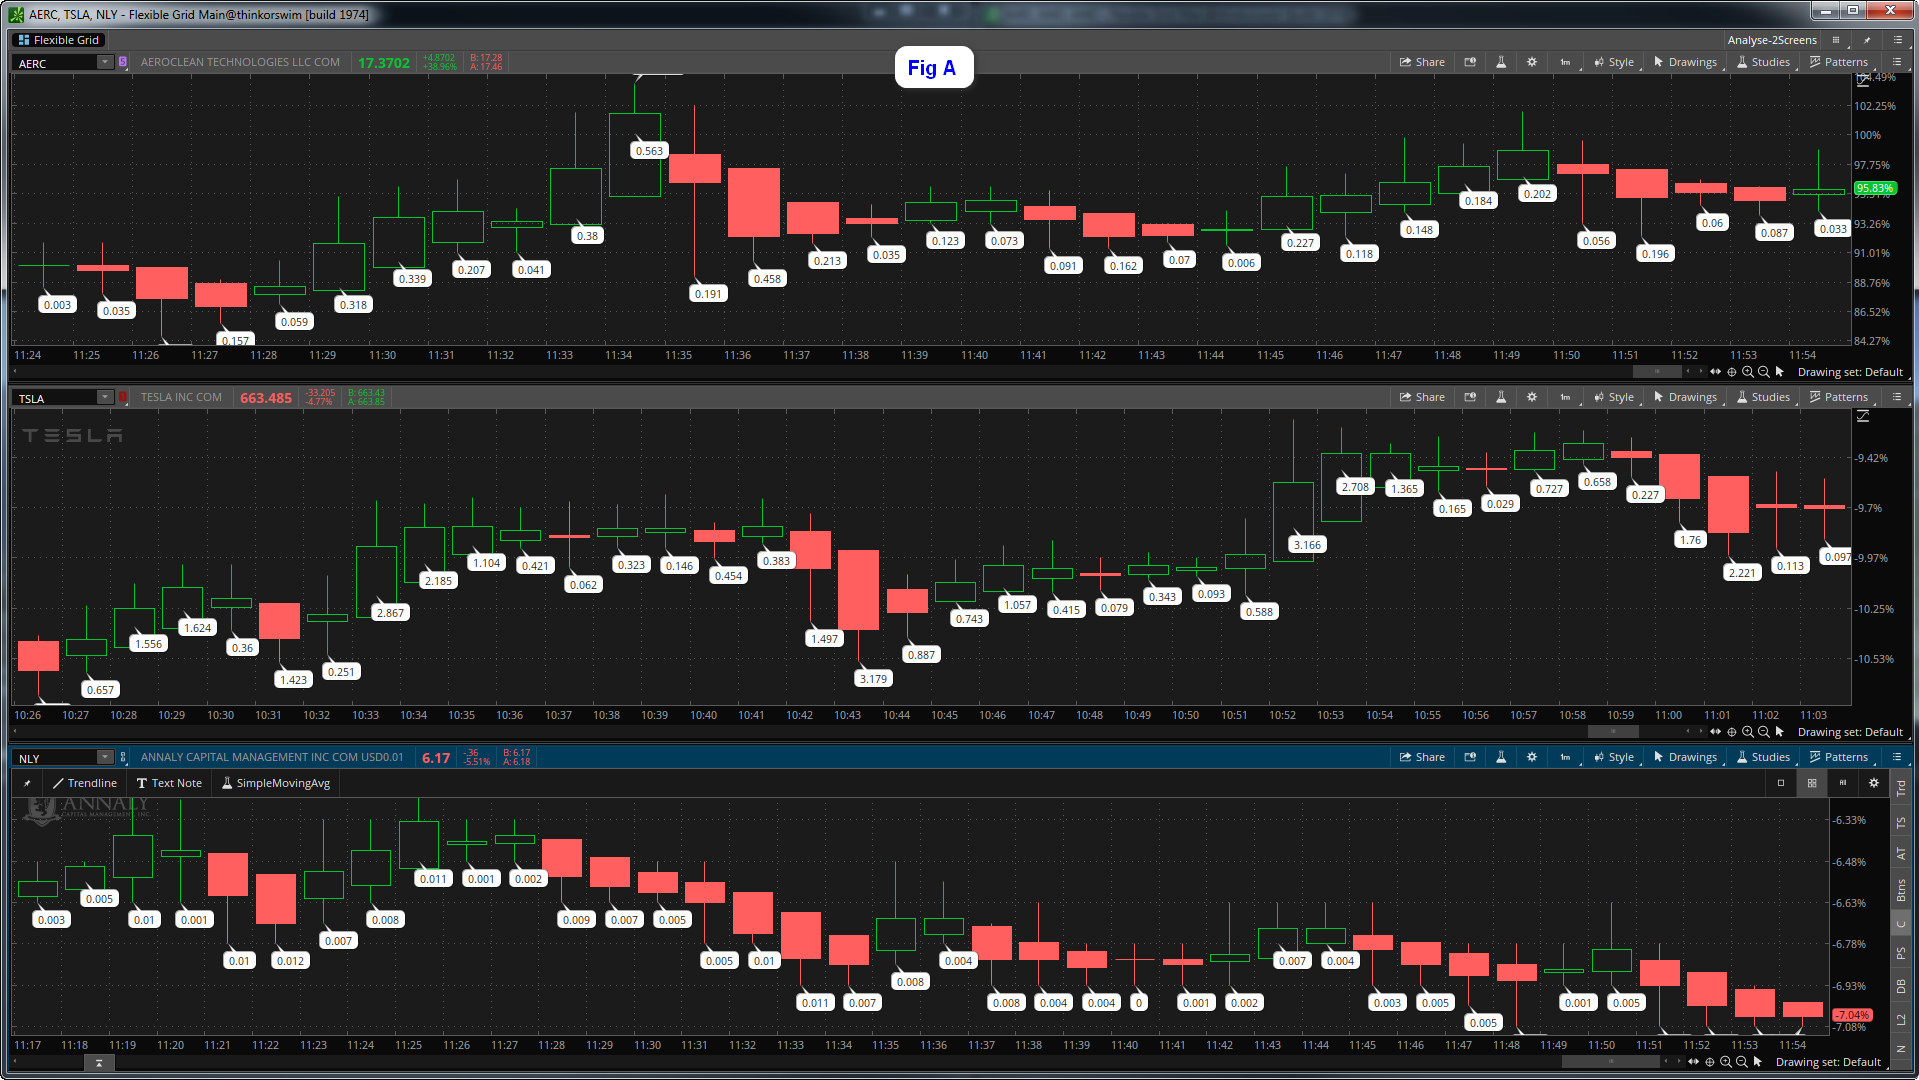
I am using the Heikin Ashi bar chart. The body height represents the strength of the trend. In order to figure out the body part height, an expert here helped me to show each bar's body height as shown in Fig A.


NmJydtW.jpg


ZRJEr6h.jpg


The actual calculated body height numbers are different with different stock prices. For example, as shown in Fig B, these three candles come from the above three stocks. They have similar body heights on the chart. But their actual calculated body heights are different and the difference is big. if a $17.37 priced stock's calculated body height is 0.118, with a similar showing bar height, its actual calculated body height is 0.658 if the stock price is $663.485. if the stock price changes to $6.17, its body height will be 0.004.

for a similar showing body height bar, the stock prices, and their calculated body heights are as the followings:

$6.17 --- 0.004
$17.37 --- 0.118
$663.485 --- 0.658

That means ThinkOrSwim must have a special formula that has the price as a factor and also some special parameters to make all different priced stocks' charts similar. Does anybody know that formula and those parameters? I try to figure out a body height that will tell me the trend is weak enough to get ready to do something. And that "body height" number should work on different priced stocks. Basically, that "body height" should be "the calculated body height" * "the parameter TOS used to balance the price difference for different stocks".
 
Here is heiken ashi line and value for body
Your code works. Now I am trying to display the top wick and bottom wick. I add the following code. But it seems it doesn't work on Green bars. Could you please correct it for me? Thank you in advance.

Code:
def isGreen = HAclose > HAopen;
def isRed = HAopen > HAclose;
def isNeutral = HAopen == HAclose;
def topWick;
def bottomWick;

if(isGreen)
{
topWick =  Round(HAhigh - HAclose, 3);
bottomWick = Round(HAopen - HAlow,3) ;
}
else if(isRed)
{
topWick = Round(HAhigh - HAopen, 3);
bottomWick = Round( HAclose - HAlow, 3);
}
else
{
topWick = Round( HAhigh - HAopen, 3);
bottomWick = Round( HAclose - HAlow, 3);
}
AddChartBubble(showbubble, high, topWick + ", " + bottomWick , Color.WHITE, no);

In my original code were incorrect for halow and hahigh the way you want to use them. The definitions were copied from an addchart code I had done previously and since I did not use hahigh or halow for your body height computation, I did not notice it.

So this should work now.

Ruby:
def o = open;
def h = high;
def l = low;
def c = close;

def HAclose = ohlc4;
def HAopen  = CompoundValue(1, (HAopen[1] + HAclose[1]) / 2, (o[1] + c[1]) / 2);
def haopen_ = HAopen;
def HAhigh  = Max(Max(h, HAopen), HAclose);
def HAlow   = Min(Min(l, HAopen), HAclose);

def isGreen = HAclose > HAopen;
def isRed = HAopen > HAclose;
def isNeutral = HAopen == HAclose;
def topWick;
def bottomWick;

if (isGreen)
{
    topWick =  round(HAhigh - HAclose, 3);
    bottomWick = round(HAopen - HAlow, 3) ;
}
else if (isRed)
{
    topWick = Round(HAhigh - HAopen, 3);
    bottomWick = Round( HAclose - HAlow, 3);
}
else
{
    topWick = Round( HAhigh - HAopen, 3);
    bottomWick = Round( HAclose - HAlow, 3);
}

input showbubble = yes;
AddChartBubble(showbubble, hahigh, topWick + "\n " + bottomWick , Color.WHITE, yes);
 
I noticed there are two ways to calculate the HAopen from the code sample in this forum:

Code:
def HAclose = (O + h + l + c) / 4;
def haclose = (O + h + l + c) / 4;

def haopen = CompoundValue(1, (haopen[1] + haclose[1]) / 2, (o[1] + c[1]) / 2);

def HAopen = CompoundValue(1, (HAopen[1] + HAclose[1]) / 2, HAclose);

Which one is correct or they are the same?
 

Join useThinkScript to post your question to a community of 21,000+ developers and traders.

Similar threads

Not the exact question you're looking for?

Start a new thread and receive assistance from our community.

87k+ Posts
408 Online
Create Post

Similar threads

Similar threads

The Market Trading Game Changer

Join 2,500+ subscribers inside the useThinkScript VIP Membership Club
  • Exclusive indicators
  • Proven strategies & setups
  • Private Discord community
  • ‘Buy The Dip’ signal alerts
  • Exclusive members-only content
  • Add-ons and resources
  • 1 full year of unlimited support

Frequently Asked Questions

What is useThinkScript?

useThinkScript is the #1 community of stock market investors using indicators and other tools to power their trading strategies. Traders of all skill levels use our forums to learn about scripting and indicators, help each other, and discover new ways to gain an edge in the markets.

How do I get started?

We get it. Our forum can be intimidating, if not overwhelming. With thousands of topics, tens of thousands of posts, our community has created an incredibly deep knowledge base for stock traders. No one can ever exhaust every resource provided on our site.

If you are new, or just looking for guidance, here are some helpful links to get you started.

What are the benefits of VIP Membership?
VIP members get exclusive access to these proven and tested premium indicators: Buy the Dip, Advanced Market Moves 2.0, Take Profit, and Volatility Trading Range. In addition, VIP members get access to over 50 VIP-only custom indicators, add-ons, and strategies, private VIP-only forums, private Discord channel to discuss trades and strategies in real-time, customer support, trade alerts, and much more. Learn all about VIP membership here.
How can I access the premium indicators?
To access the premium indicators, which are plug and play ready, sign up for VIP membership here.
Back
Top