Hi, I’m a medium term stock swing trader. One of my frustrations with ToS is that when I’m looking at a chart for a position I hold and determining if I should Add or Reduce/Sell, I want to see the position information from the Monitor tab. I’m constantly toggling back and forth between those 2 tabs and it occurred to me I could probably use thinkscript to show that info on the chart. I am specifically looking for:
- # of shares
- Trade price
- Net Liq
- P/L%
- P/L Open
I'm hoping someone can point me to an example of something similar that I can adapt.
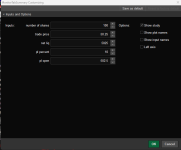
Thanks in advance for any help and I'm posting a mockup of what I'm looking for below. (I am not looking for this formatting, just a way to see the info for an active position.)
View attachment 21077I am new to trading and also share your frustration. From the looks, brokerage firms put enough on these tools but not enough for you to compete with the same tools.
ThinkScript does not have direct access to dynamically load real-time account or position-specific information such as number of shares held, trade price, net liquidation value, and profit/loss percentages. This is largely due to security and design limitations to ensure that scripts running on charts cannot directly interact with sensitive account data.
The platform is designed to separate trading functions and scripting for indicators and strategies to maintain security and integrity. While this ensures that scripts cannot accidentally or maliciously affect your trading positions, it also means that traders cannot automate or script dynamic displays of their account or position data directly on the charts. The most I have is a manual entry for large items I'd be happy to share BELOW:
# Using input fields to allow for easy adjustments from the chart interface
input numberOfShares = 100;
input tradePrice = 50.25;
input netLiq = 5025; # You can manually adjust this or automate based on the trade price and number of shares
input plPercent = 10; # Percent profit or loss
input plOpen = 502.50; # Open profit or loss
# Add labels to display the data on the chart
AddLabel(yes, "Shares: " + numberOfShares, Color.WHITE);
AddLabel(yes, "Trade Price: $" + tradePrice, Color.WHITE);
AddLabel(yes, "Net Liq: $" + netLiq, Color.WHITE);
AddLabel(yes, "P/L %: " + plPercent + "%", Color.WHITE);
AddLabel(yes, "P/L Open: $" + plOpen, Color.WHITE);