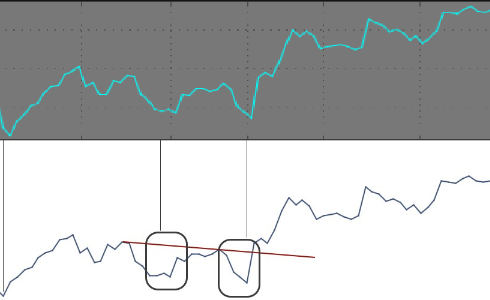
Can anyone infer how NextSignals is coding these indicators

Glefdar

Active member
Link:
enPXbCH.png


One of the replies says that calls sold vs. bought and puts sold vs. bought is determined as follows:

Determined by the option positions Greeks. Gamma is positive for both long calls and long puts, negative for the opposite. long a call and short puts positive Short calls and long puts negative Would help to understand color and charm’s effect too.

I could be wrong but I am guessing this must be a chart of a single strike level, and the "Calls" lower study is using the call for that strike as the data source and the "Puts" lower study is using the put for that strike as the data source. But it's not clear to me how gamma is being used to disambiguate volumes of contracts sold vs. bought in that case. Maybe someone has a better understanding of what he's doing?
 
I am not completely certain yet, but this should be the direct translation of the zero dividends Vanna formula shown. I am having trouble locating examples for a good comparison.

Code:
def Under =
    Close(GetunderlyingSymbol());
def Strike =
    GetStrike();
def DTE =
    GetDaysToExpiration() / 365;
def Rate =
    GetInterestRate() * 0.01;
def Div =
    if !isNaN(GetDividend()) then GetDividend()
    else Div[1];
def Yield =
    if Div then Div / Under
    else 0;
def IV =
    Imp_Volatility(GetUnderlyingSymbol());
def Pi =
    Double.Pi; #3.14
def e =
    2.718281828; #Euler's number (sort of like Pi)
def D1 =
    (Log(Under/Strike) + (rate - yield + (Power(IV,2) / 2)) * DTE) / (IV * Sqrt(DTE));
def N1D1 =
    power(e,-(power(D1,2)/2)) * (1 / (2 * Pi));
def Van =
    SqRt(DTE) * N1D1 * (1 - D1); #assumes 0 dividend

plot Vanna = Van * -1;

Edit: Further decimalized the interest rate, inverted the plot (still not sure why), found an example with a chart that TOS would actually load.

CJuuYfA.png

Thanks for sharing your code for the vanna formula, this is fantastic. Is there a similar code for gamma available that specifically would plot on an intraday chart without normalization and show convergent highs and lows with vanna, as in the example that Dr. Harlin screenshotted? It’s not clear to me from his screenshot if those plots are normalized or re-scaled by squishing two studies into one lower section, or if they should natively have close enough scale that they’d work out of the box for accurately showing convergence.

Edit: It looks like there is a Mobius code available already for spot gamma, so that part is answered. I'm still curious if anyone has insight about the questions about whether the vanna and gamma lines in Dr. Harlin's screenshot need to be normalized or not.
 
Last edited:
The original formula can be found here. I just did my best to translate it verbatim to help out. Other than that, I'm not interested in Vanna personally, I haven't given it any thought since my last post. There is a lack of authoritative examples of it being done correctly for comparison. I really have no way of verifying whether or not it's correct, or even if the formula on that website is correct in the first place.
 
I find the tone of this conversation very relaxing. 😌
No one promotes any ' Guru ' yet everyone observes how data works...

A true Trust But Verify...

Like many of us I loved ToS option courses where the curved value of time is made intuitive l I also liked all those green options workbooks. https://tlc.thinkorswim.com/center

On this thread I like the idea of looking at how much extra premium is paid for options; as in my spreadsheets that fear seems to always come before the end of a trend. :unsure:

Also when the sizzle, or unusual options positions scripts direct my attention to a fringe stock with 100s of naked calls and puts all written at the exact same time and strike price. I become very skeptical that anyone is actually sitting there ready to shoulder that much risk. I'm starting to suspect there are sacrificial corporations who are willing to suicide to help their real owners. :cool:
Haha who knows? :p
 

Join useThinkScript to post your question to a community of 21,000+ developers and traders.

Similar threads

Not the exact question you're looking for?

Start a new thread and receive assistance from our community.

87k+ Posts
240 Online
Create Post

Similar threads

Similar threads

The Market Trading Game Changer

Join 2,500+ subscribers inside the useThinkScript VIP Membership Club
  • Exclusive indicators
  • Proven strategies & setups
  • Private Discord community
  • ‘Buy The Dip’ signal alerts
  • Exclusive members-only content
  • Add-ons and resources
  • 1 full year of unlimited support

Frequently Asked Questions

What is useThinkScript?

useThinkScript is the #1 community of stock market investors using indicators and other tools to power their trading strategies. Traders of all skill levels use our forums to learn about scripting and indicators, help each other, and discover new ways to gain an edge in the markets.

How do I get started?

We get it. Our forum can be intimidating, if not overwhelming. With thousands of topics, tens of thousands of posts, our community has created an incredibly deep knowledge base for stock traders. No one can ever exhaust every resource provided on our site.

If you are new, or just looking for guidance, here are some helpful links to get you started.

What are the benefits of VIP Membership?
VIP members get exclusive access to these proven and tested premium indicators: Buy the Dip, Advanced Market Moves 2.0, Take Profit, and Volatility Trading Range. In addition, VIP members get access to over 50 VIP-only custom indicators, add-ons, and strategies, private VIP-only forums, private Discord channel to discuss trades and strategies in real-time, customer support, trade alerts, and much more. Learn all about VIP membership here.
How can I access the premium indicators?
To access the premium indicators, which are plug and play ready, sign up for VIP membership here.
Back
Top