Link:

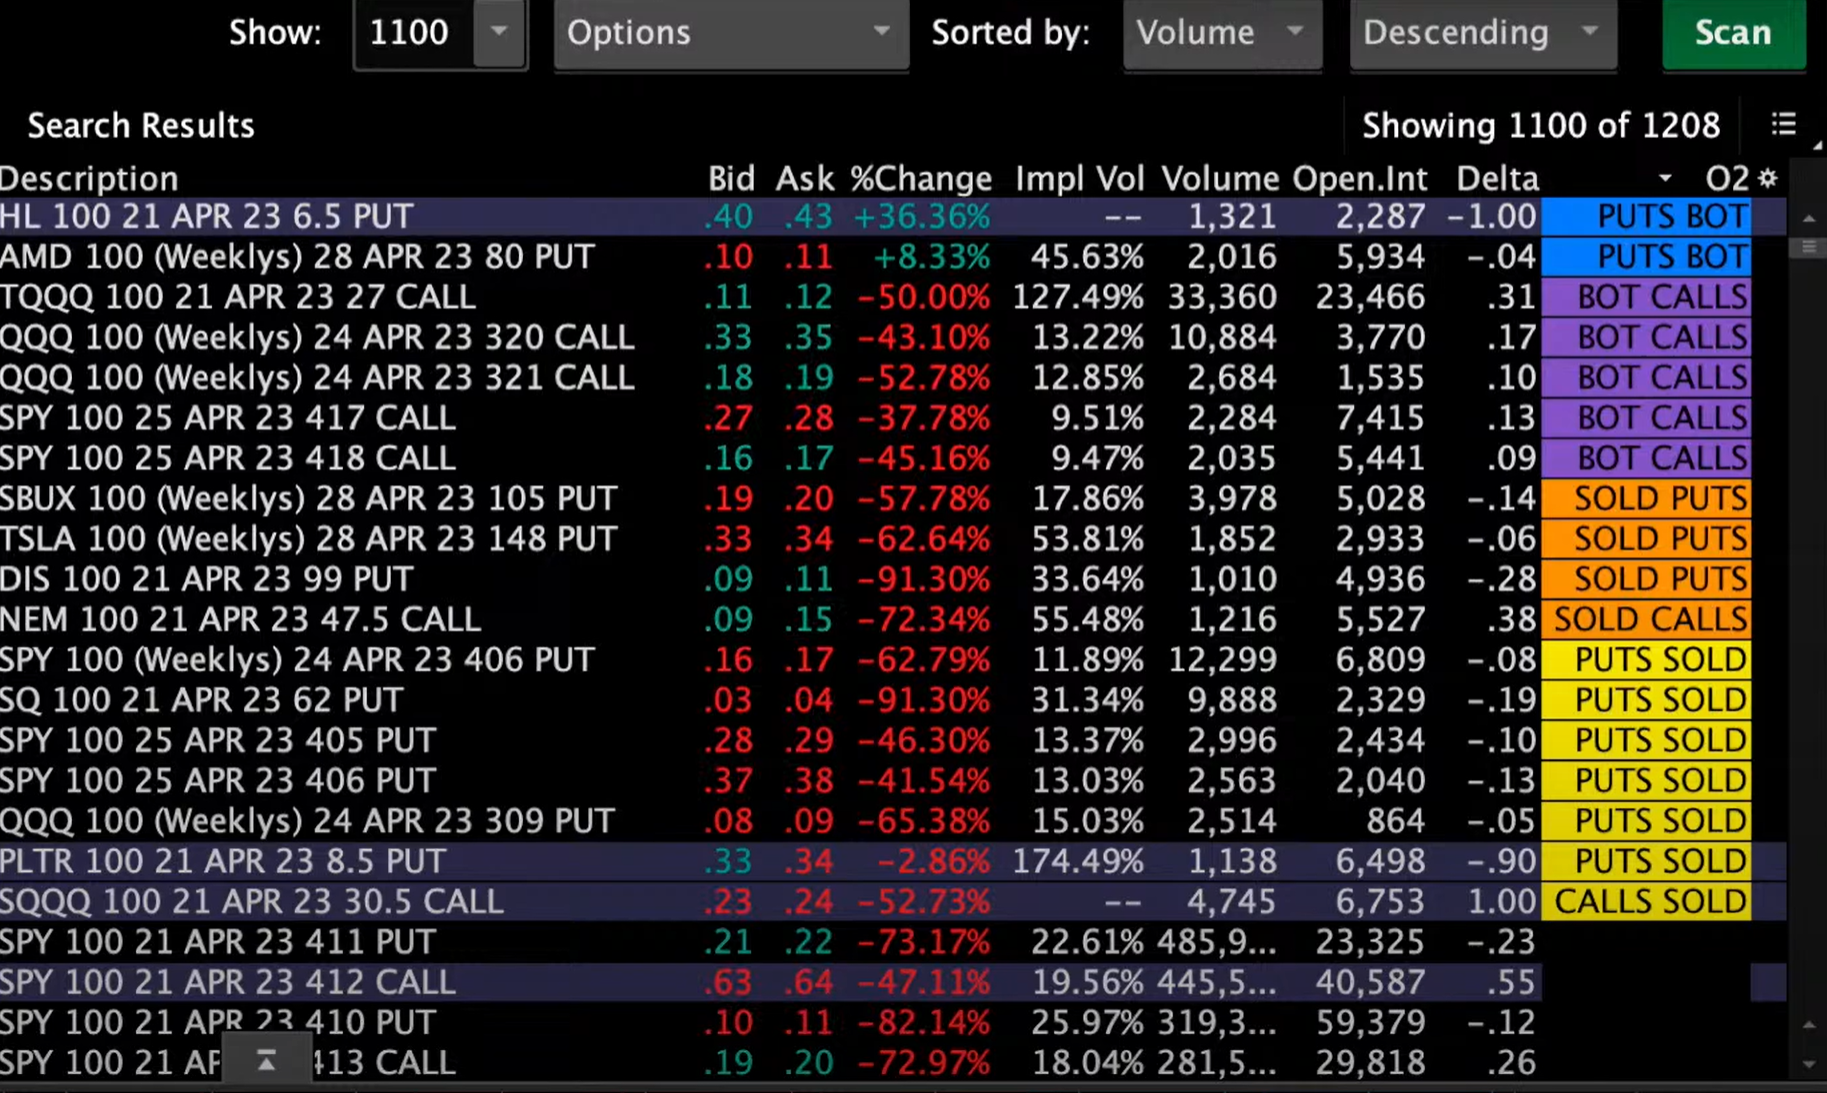
One of the replies says that calls sold vs. bought and puts sold vs. bought is determined as follows:
I could be wrong but I am guessing this must be a chart of a single strike level, and the "Calls" lower study is using the call for that strike as the data source and the "Puts" lower study is using the put for that strike as the data source. But it's not clear to me how gamma is being used to disambiguate volumes of contracts sold vs. bought in that case. Maybe someone has a better understanding of what he's doing?
One of the replies says that calls sold vs. bought and puts sold vs. bought is determined as follows:
Determined by the option positions Greeks. Gamma is positive for both long calls and long puts, negative for the opposite. long a call and short puts positive Short calls and long puts negative Would help to understand color and charm’s effect too.
I could be wrong but I am guessing this must be a chart of a single strike level, and the "Calls" lower study is using the call for that strike as the data source and the "Puts" lower study is using the put for that strike as the data source. But it's not clear to me how gamma is being used to disambiguate volumes of contracts sold vs. bought in that case. Maybe someone has a better understanding of what he's doing?