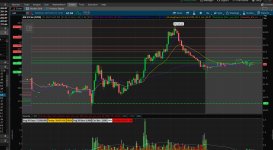
# Camarilla pivots Support and resistance lines
# Strategy designed by Prince
# Prince - v1  - 2021/03/24
# Plots Resistance "H" and Support "L" lines based previous day High, Low, Close.
# Bull zone and Bear zones are highlighted in green and red respectively
# Plots dynamic support and resistance lines with EMA 50 & 200
# Need to evaluate for Futures and already labeled with other exchange timings.
# This code is still under back testing. Appreciate your help to enhance for better results


def prevdayhi =HighestAll(high(period = AggregationPeriod.DAY)[1]);
def prevdaylo= LowestAll(low(period = AggregationPeriod.DAY)[1]);
def prevdayclose= close(period = AggregationPeriod.DAY)[1];

plot H6 = (prevdayhi/(prevdayhi-prevdaylo))*prevdayclose;
plot H5 = (prevdayhi/prevdaylo)*prevdayclose;
plot H4 = 0.55*(prevdayhi - prevdaylo) + prevdayclose;
plot H3 = 0.275*(prevdayhi - prevdaylo) + prevdayclose;
plot H2 = 0.183*(prevdayhi - prevdaylo) + prevdayclose;
plot H1 = 0.0916*(prevdayhi - prevdaylo) + prevdayclose;


plot L1 = prevdayclose - 0.0916*(prevdayhi - prevdaylo);
plot L2 = prevdayclose - 0.183*(prevdayhi - prevdaylo);
plot L3 = prevdayclose - 0.275*(prevdayhi - prevdaylo);
plot L4 = prevdayclose - 0.55*(prevdayhi - prevdaylo);
plot L5 = (prevdayclose - (H5 - prevdayclose));
plot L6 = (prevdayclose - (H6 - prevdayclose));

plot HSL = (L3+L4)/2;
plot LSL = (H3+H4)/2;

def na = Double.NaN;
def bno = BarNumber();
def h  = high;
def l  = low;
def cb   = HighestAll(if !IsNaN(h) then bno else na);

def barnumber = barNumber();
def day = getDay();
def month = getMonth();
def year = getYear();
def lastDay = getLastDay();
def lastmonth = getLastMonth();
def lastyear = getLastYear();
def isToday = if(day == lastDay and month == lastmonth and year == lastyear, 1, 0);
def istodaybarnumber = HighestAll(if isToday then barnumber else double.nan);


AddChartBubble((barnumber == istodaybarnumber), H5, "H5:Long Target "+round(H5), Color.GREEN);
AddChartBubble((barnumber == istodaybarnumber), H4, "H4:Go Long above "+round(H4), Color.GREEN);
AddChartBubble((barnumber == istodaybarnumber), H3, "H3:Go Short below "+round(H3), Color.orange);
AddChartBubble((barnumber == istodaybarnumber), H2, "H2", Color.GREEN);
AddChartBubble((barnumber == istodaybarnumber), H1, "H1", Color.GREEN);

AddChartBubble((barnumber == istodaybarnumber), L1, "L1", Color.ORANGE);
AddChartBubble((barnumber == istodaybarnumber), L2, "L2", Color.ORANGE);
AddChartBubble(barnumber == istodaybarnumber, L3, "L3:Go Long above "+round(L3), Color.green);
AddChartBubble((barnumber == istodaybarnumber), L4, "L4:Go Short below "+round(L4), Color.ORANGE);
AddChartBubble((barnumber == istodaybarnumber), L5, "L5:Short Target "+round(L5), Color.ORANGE);

#AddChartBubble((barnumber == istodaybarnumber), HSL, "Stop@"+round(HSL), Color.red);
#AddChartBubble((barnumber == istodaybarnumber), LSL, "Stop"+round(LSL), Color.red);


#H1.Hide();
#L1.Hide();

H6.SetDefaultColor(GetColor(5));
H5.SetDefaultColor(GetColor(5));
H4.SetDefaultColor(GetColor(5));
H3.SetDefaultColor(GetColor(5));
H2.SetDefaultColor(GetColor(5));
H1.SetDefaultColor(GetColor(5));
L1.SetDefaultColor(GetColor(6));
L2.SetDefaultColor(GetColor(6));
L3.SetDefaultColor(GetColor(6));
L4.SetDefaultColor(GetColor(6));
L5.SetDefaultColor(GetColor(6));
L6.SetDefaultColor(GetColor(6));

def paintingStrategy = PaintingStrategY.DASHES;

H6.SetPaintingStrategy(paintingStrategy);
H5.SetPaintingStrategy(paintingStrategy);
H4.SetPaintingStrategy(paintingStrategy);
H3.SetPaintingStrategy(paintingStrategy);
H2.SetPaintingStrategy(paintingStrategy);
H1.SetPaintingStrategy(paintingStrategy);
L1.SetPaintingStrategy(paintingStrategy);
L2.SetPaintingStrategy(paintingStrategy);
L3.SetPaintingStrategy(paintingStrategy);
L4.SetPaintingStrategy(paintingStrategy);
L5.SetPaintingStrategy(paintingStrategy);
L6.SetPaintingStrategy(paintingStrategy);

def buy = (close crosses above L3 ) or
           (close crosses above L5 ) or
          (close crosses above H4 );

def sell = (close crosses below H3 ) or
            (close crosses below H5 ) or
           (close crosses below L4 );

#addchartbubble(buy,low,"L",color.green);
#addchartbubble(sell,high,"S",color.orange);

plot ema200 = ExpAverage(close, 200);
ema200.SetDefaultColor(color.red);
ema200.SetPaintingStrategy(paintingStrategy = PaintingStrategy.DASHES);
ema200.setLineWeight(2);
AddChartBubble((cb == bno), ema200, "EMA200 "+round(ema200), Color.lighT_RED);
input paintbars = no;
AssignPriceColor(if paintbars and close <= ema200 then Color.RED else Color.GREEN);

AddCloud(H5, H4, Color.GREEN);
AddCloud(L4, L5, Color.red);

plot ema50 = ExpAverage(close, 50);
ema50.SetDefaultColor(color.lime);
ema50.SetPaintingStrategy(paintingStrategy = PaintingStrategy.DASHES);
ema50.setLineWeight(1);
AddChartBubble((cb == bno), ema50, "EMA50 "+round(ema50), Color.lime,no);

addchartBubble(SecondsTillTime(1900)==0,highestAll(high),"Sydney Open",color.white);
addchartBubble(SecondsTillTime(2000)==0,highestAll(high),"Tokyo Open",color.white);
addchartBubble(SecondsTillTime(2130)==0,highestAll(high),"Hong kong Open",color.white);
addchartBubble(SecondsTillTime(300)==0,highestAll(high),"Frankfurt Open",color.white);
addchartBubble(SecondsTillTime(400)==0,highestAll(high),"London Open",color.white);
addchartBubble(SecondsTillTime(0930)==0,highestAll(high),"NYSE Open",color.white);

