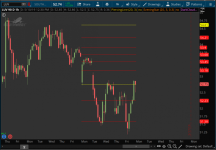
This indicator for ThinkorSwim takes the high and low of the previous week or month and add Fibonacci retracement levels to create potential support and resistance levels. You can also use the high and low of the previous day, yearly, etc. Up to you to select the right timeframe to help your trading style.

thinkScript Code
Rich (BB code):
#
# WalkingBallista & BenTen
# https://usethinkscript.com/d/153-high-and-low-with-fibonacci-retracement-indicator-for-thinkorswim
input aggregationPeriod = AggregationPeriod.DAY;
input ShowTodayOnly = yes;

def PH = high(period = aggregationPeriod)[1];
def PL = low(period = aggregationPeriod)[1];
def PO = open(period = aggregationPeriod);
def Today = if GetDay() == GetLastDay() then 1 else 0;
def Week = if GetWeek() == GetLastWeek() then 1 else 0;

def range = PH - PL;
input fib = 1.618;
input fib1 = 1.272;
input fib2 = 0.618;
input fib3 = 0.236;
input fib4 = 0.382;
input fib5 = 0.5;
input fib6 = 0.786;
input fib7 = 2.618;

plot h = if ShowTodayOnly and !Today and aggregationPeriod == AggregationPeriod.Day then Double.NaN else if ShowTodayOnly and !Week and aggregationPeriod == AggregationPeriod.Week then Double.NaN else PH + range*(fib-1);
plot h1 = if ShowTodayOnly and !Today and aggregationPeriod == AggregationPeriod.Day then Double.NaN else if ShowTodayOnly and !Week and aggregationPeriod == AggregationPeriod.Week then Double.NaN else PH + range*(fib1-1);
plot h2 = if ShowTodayOnly and !Today and aggregationPeriod == AggregationPeriod.Day then Double.NaN else if ShowTodayOnly and !Week and aggregationPeriod == AggregationPeriod.Week then Double.NaN else PH + range*(fib2-1);
plot h3 = if ShowTodayOnly and !Today and aggregationPeriod == AggregationPeriod.Day then Double.NaN else if ShowTodayOnly and !Week and aggregationPeriod == AggregationPeriod.Week then Double.NaN else PH + range*(fib3-1);
plot h4 = if ShowTodayOnly and !Today and aggregationPeriod == AggregationPeriod.Day then Double.NaN else if ShowTodayOnly and !Week and aggregationPeriod == AggregationPeriod.Week then Double.NaN else PH + range*(fib4-1);
plot h5 = if ShowTodayOnly and !Today and aggregationPeriod == AggregationPeriod.Day then Double.NaN else if ShowTodayOnly and !Week and aggregationPeriod == AggregationPeriod.Week then Double.NaN else PH + range*(fib5-1);
plot h6 = if ShowTodayOnly and !Today and aggregationPeriod == AggregationPeriod.Day then Double.NaN else if ShowTodayOnly and !Week and aggregationPeriod == AggregationPeriod.Week then Double.NaN else PH + range*(fib6-1);
plot h7 = if ShowTodayOnly and !Today and aggregationPeriod == AggregationPeriod.Day then Double.NaN else if ShowTodayOnly and !Week and aggregationPeriod == AggregationPeriod.Week then Double.NaN else PH + range*(fib7-1);
plot h8 = if ShowTodayOnly and !Today and aggregationPeriod == AggregationPeriod.Day then Double.NaN else if ShowTodayOnly and !Week and aggregationPeriod == AggregationPeriod.Week then Double.NaN else PL - range*(fib1-1);
plot h9 = if ShowTodayOnly and !Today and aggregationPeriod == AggregationPeriod.Day then Double.NaN else if ShowTodayOnly and !Week and aggregationPeriod == AggregationPeriod.Week then Double.NaN else PL - range*(fib-1);
plot h10 = if ShowTodayOnly and !Today and aggregationPeriod == AggregationPeriod.Day then Double.NaN else if ShowTodayOnly and !Week and aggregationPeriod == AggregationPeriod.Week then Double.NaN else PL - range*(fib7-1);

h.DefineColor("Color", Color.DARK_RED);
h.AssignValueColor(h.color("Color"));
h.SetPaintingStrategy(PaintingStrategy.HORIZONTAL);

h1.DefineColor("Color", Color.RED);
h1.AssignValueColor(h1.color("Color"));
h1.SetPaintingStrategy(PaintingStrategy.HORIZONTAL);

h2.DefineColor("Color", Color.RED);
h2.AssignValueColor(h2.color("Color"));
h2.SetPaintingStrategy(PaintingStrategy.HORIZONTAL);

h3.DefineColor("Color", Color.RED);
h3.AssignValueColor(h3.color("Color"));
h3.SetPaintingStrategy(PaintingStrategy.HORIZONTAL);

h4.DefineColor("Color", Color.RED);
h4.AssignValueColor(h3.color("Color"));
h4.SetPaintingStrategy(PaintingStrategy.HORIZONTAL);

h5.DefineColor("Color", Color.RED);
h5.AssignValueColor(h3.color("Color"));
h5.SetPaintingStrategy(PaintingStrategy.HORIZONTAL);

h6.DefineColor("Color", Color.RED);
h6.AssignValueColor(h3.color("Color"));
h6.SetPaintingStrategy(PaintingStrategy.HORIZONTAL);

h7.DefineColor("Color", Color.RED);
h7.AssignValueColor(h3.color("Color"));
h7.SetPaintingStrategy(PaintingStrategy.HORIZONTAL);

h8.DefineColor("Color", Color.RED);
h8.AssignValueColor(h3.color("Color"));
h8.SetPaintingStrategy(PaintingStrategy.HORIZONTAL);

h9.DefineColor("Color", Color.RED);
h9.AssignValueColor(h3.color("Color"));
h9.SetPaintingStrategy(PaintingStrategy.HORIZONTAL);

h10.DefineColor("Color", Color.RED);
h10.AssignValueColor(h3.color("Color"));
h10.SetPaintingStrategy(PaintingStrategy.HORIZONTAL);

plot highofline = if ShowTodayOnly and !Today and aggregationPeriod == AggregationPeriod.Day then Double.NaN else if ShowTodayOnly and !Week and aggregationPeriod == AggregationPeriod.Week then Double.NaN else PH;
highofline.DefineColor("Color", Color.YELLOW);
highofline.AssignValueColor(highofline.color("Color"));
highofline.SetPaintingStrategy(PaintingStrategy.HORIZONTAL);

plot lowofline = if ShowTodayOnly and !Today and aggregationPeriod == AggregationPeriod.Day then Double.NaN else if ShowTodayOnly and !Week and aggregationPeriod == AggregationPeriod.Week then Double.NaN else PL;
lowofline.DefineColor("Color", Color.YELLOW);
lowofline.AssignValueColor(highofline.color("Color"));
lowofline.SetPaintingStrategy(PaintingStrategy.HORIZONTAL);
Shareable Link
https://tos.mx/UoIuknVideo Tutorial
Attachments
Last edited:

