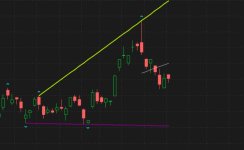
I'm trying to use this code as a condition for a SCAN (one that finds broadening formations in addition to other parameters).
I have the code imported and applied to charts, and that is working fine.
When I copy/paste the code into CUSTOM (thinkscript) on the SCAN definition page, it posts and error about 'AddLabel not allowed in this context'. I suspect this has to do with drawing and labeling the chart, but I don't know what or how to edit the script so that it will work in the SCAN. Any help or guidance?
They idea I have here, is I want to have a 'dynamic watchlist' that shows only those symbols where the broadening pattern is being found.
I also wonder.... if it would be possible to incorporate some additional level of fidelity into this script.
The fidelity I refer to here, has to do with 'symmetry' of broadening, and 'angle' of upper and lower lines.
First, would be to focus on 'angle'. The angles of the upper and lower lines need to be within a user-specified value; with a default of 45-degrees.
Symmetry; would be that both upper and lower angles are within a user-specified 'threshold' of each other, say, +/- 1% to 50% variance of the angle with the lower-angled slope of the two slopes.
To become truly 'actionable' for setups, we want to find broadening patterns based on the most recent candle, going backward upto a user-specified number of candles (width) of the pattern. Finding a broadening pattern in history is not actionable.
Lastly, would be able to specify the height, or the 'delta' (or delta-range) between the highest-high price, and the lowest-low price, thus... find only broadening patterns where the height of the broadening pattern is at least 'z-high' (or, is between z1 and z2 in height).
So, in summary (in total), find broadening patterns that 'starting for today/yesterday' and looking backward, are at least x-candles wide between at the last 2 (ideally 3) highest highs and lowest lows, and are at least y-price high (between the highest high and lowest low, and the slopes of the upper lower lines are within d-degrees, and have v% variance of degrees between the 2 slopes. (where x, y, d, v and z(1,2) are user-specified.
This would be PERFECT...
Here's a great post on calculating
slopes.
It almost feels like there's one more parameter needed; to skip over and find the 'next low (or high) back.. if the next lower-low/high is within 't-bars'. For example, if moving backward from now, the 2nd lowest low, or 2nd highest high is within t-bars of the first, then ignore it, and find the next lower low or higher high after that one, and use THAT one, as the 2nd point.
And to be truly truly actionable, the price needs to be within the 'highest high, and lowest low'. (thus, a toggle, 'Price is within the highest high, and lowest low of the broadening? Y/N'
I'll post some examples, being done by site and manually drawn.
Were you able to get this code to work in a SCAN ?
I have the script loaded and applied to a chart and it works there, but when I copy the script into a CUSTOM Filter Condition as part of a SCAN ( Ideal was to scan for symbols that have the broadening formation present); I get the same error you mentioned about 'Add Label not allowed in this Context', and I have now idea how or what to do to fix this.

