
I found this via the Yahoo's thinkScript group.


Credits:
hi-i'm using Larthomp's 'Big Bar Breakout' which Colors the Big Bars Yellow. Would it be possible to hide all other Bars / Candles on the chart ; and only show the current / last one to five bars , by user input ? thanks in advance for any help.
Let me clarify- '' Hide all Price Bars / Candles'' - do not hide any Wide Breakout ( yellow/magenta) bars.
Thanks again for this great script ! I use the rectangle tool to draw a dark gray cloud over the Yellow / magenta bar and extend right 'X' bars in future. Can this Big Bar Cloud be automated into the script with user input ? Thanks again.
hi-I don't know if this idea is feasible; but would it be possible to create an ema of the Big Bars ( yellow / magenta ) only ? Thanks .
thinkScript Code
Code:
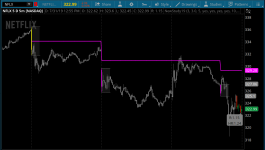
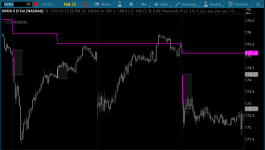
#Added optional horizontal lines at high/low of breakout/breakdown bars, with options to show clouds and limit the length of the lines/clouds

#Breakout/Breakdown based upon input of BigBarsize (Current bar's range is at least input of bigbarsize multiple of the highest range of the input of number of priorbars)
#Three options for alerting a BigBar Breakout/Breakdown
#Added input last_bars_displayed to show the actual bar color of these input number of bars, except breakout and breakdown bars, which will always be colored yellow or magenta. All other bars will be colored gray.
#Added optional horizontal lines at high/low of breakout/breakdown bars, with options to show clouds and limit the length of the lines/clouds
#Added Average of breakout/breakdown bars

input priorbars = 3;
input bigbarsize = 3.0;
def range = high - low;
def breakout = if high > Highest(high[1], priorbars) and
range >= Highest(range[1], priorbars) * bigbarsize
then 1 else 0;
def breakdown = if low < Lowest(low[1], priorbars) and
range >= Highest(range[1], priorbars) * bigbarsize
then 1 else 0;

def lastbar = if !IsNaN(close) and IsNaN(close[-1]) then BarNumber() else Double.NaN;
input last_bars_displayed = 5;

input coloralert = yes;
AssignPriceColor(if coloralert and breakout then Color.YELLOW else
if coloralert and breakdown then Color.MAGENTA else
if BarNumber() < HighestAll(lastbar) - last_bars_displayed then Color.GRAY
else Color.CURRENT);

def b_high = if breakdown or breakout then high else b_high[1];
def b_low  = if breakdown or breakout then low  else b_low[1];
input show_clouds        = yes;
input show_horizontals   = yes;
input limit_cloud_length = yes;
input cloud_length       = 10;
def b_length = if breakdown or breakout then 1 else b_length[1] + 1;

plot hh = if show_horizontals then
if limit_cloud_length == no or limit_cloud_length == yes and b_length <= cloud_length then b_high
else Double.NaN
else Double.NaN;

plot ll = if show_horizontals then
if limit_cloud_length == no or limit_cloud_length == yes and b_length <= cloud_length then b_low
else Double.NaN
else Double.NaN;

hh.SetPaintingStrategy(PaintingStrategy.HORIZONTAL);
ll.SetPaintingStrategy(PaintingStrategy.HORIZONTAL);
hh.SetDefaultColor(Color.GRAY);
ll.SetDefaultColor(Color.GRAY);

AddCloud(if !show_clouds then Double.NaN else hh, ll, Color.DARK_GRAY, Color.DARK_GRAY);

input soundalert = yes;
Alert(soundalert and breakout , "Breakout" , Alert.BAR, Sound.Ding);
Alert(soundalert and breakdown, "Breakdown", Alert.BAR, Sound.Ding);

input bubblealert = yes;
input tick_offset = 3;
AddChartBubble(bubblealert and IsNaN(close[-1]),
low - TickSize() * tick_offset,
" R:" + AsText(range) + "\nHR:" + AsText(Highest(range[1], priorbars)),
if breakout then Color.YELLOW else
if breakdown then Color.MAGENTA
else Color.GRAY, no);

def fb    = if !breakout and !breakdown and (breakdown or breakout) then 1 else fb[1] + 1;
def b_tot = if fb >= 1 and (breakout or breakdown) then (b_high+b_low)/2 + b_tot[1] else b_tot[1];
def b_ct  = if fb >= 1 and (breakout or breakdown) then b_ct[1] + 1 else b_ct[1];
plot Avg  = if fb >= 1 then b_tot / b_ct else Double.NaN;
Avg.SetDefaultColor(Color.MAGENTA);
Avg.SetLineWeight(2);
Shareable Link
https://tos.mx/VQ29hGCredits:
")