
Author Message:
his Indicator Identifies and draws the support and resistance Zones On the Chart
 Overview
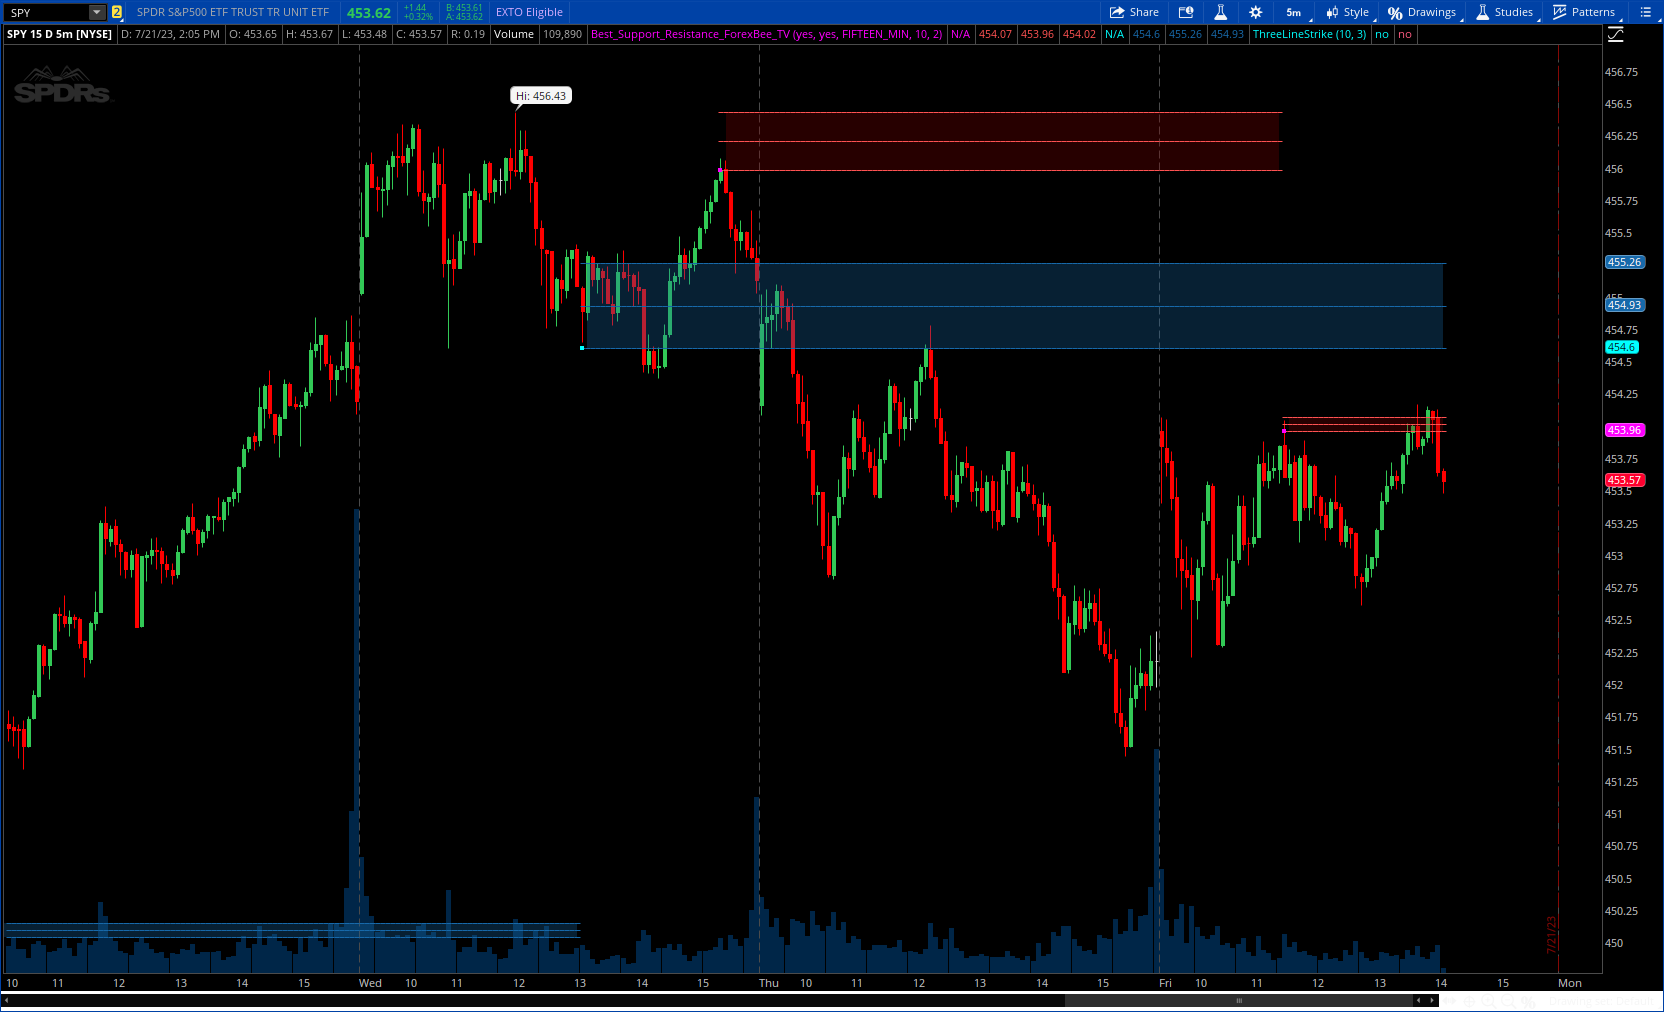
The support and resistance indicator is a technical indicator that will plot the support zone and resistance zone on the candlestick chart. It determines the price touches to find the strong support resistance zones.
The support and resistance indicator is the most basic technical analysis in trading. Instead of drawing zones manually, this indicator can save you time by plotting zones automatically.
More details: https://www.tradingview.com/v/EaDischm/
CODE:
CSS:
#https://www.tradingview.com/v/EaDischm/
#//@ForexBee
#Best Support And Resistance Indicator V1 [ForexBee]
#indicator("Best S&R Indicator", overlay=true)
# Converted by Sam4Cok@Samer800    - 07/2023
input extendLines = yes;
input useChartTimeframe = {default "yes", "No"};
input manualTimeframe   = AggregationPeriod.FIFTEEN_MIN;
input Bars  = 10;# , "Number Of Bars For Swing" , 5 , confirm = true)
input NoOfTestedPivots = {default "2", "3", "4"};# , "No of Tests for a Valid S and R Level" , options = [2,3,4] , confirm = true )

def na = Double.NaN;
def last = IsNaN(close);
#DefineGlobalColor("up", CreateColor(76, 175, 80));
DefineGlobalColor("dn", CreateColor(255, 82, 82));
DefineGlobalColor("up", CreateColor(23, 105, 170));

def c; def h; def l; def o;
switch (useChartTimeframe) {
case "yes" :
    c = close;
    h = high;
    l = low;
    o = open;
case "No" :
    c = close(Period = manualTimeframe);
    h = high(Period = manualTimeframe);
    l = low(Period = manualTimeframe);
    o = open(Period = manualTimeframe);
}

def NoOfPivots;
switch (NoOfTestedPivots) {
case "2" :
    NoOfPivots = 2;
case "3" :
    NoOfPivots = 3;
case "4" :
    NoOfPivots = 4;
}
script FindPivots {
    input dat = hl2; # default data or study being evaluated
    input HL  = 0;    # default high or low pivot designation, -1 low, +1 high
    input lbL  = 5;    # default Pivot Lookback Left
    input lbR  = 1;    # default Pivot Lookback Right
    ##############
    def _nan;    # used for non-number returns
    def _BN;     # the current barnumber
    def _VStop;  # confirms that the lookforward period continues the pivot trend
    def _V;      # the Value at the actual pivot point
    ##############
    _BN  = if !IsNaN(dat) then _BN[1] + 1 else _BN[1];#CompoundValue(1, BarNumber(), 0);
    _nan = Double.NaN;
    _VStop = if _BN > lbL and lbR > 0 and lbL > 0 then
                fold i = 1 to lbR + 1 with q=yes while q do
                if HL > 0 then dat > GetValue(dat, -i) else dat < GetValue(dat, -i) else _nan;
    if (HL > 0) {
        _V = if _BN > lbL and dat == Highest(dat, lbL + 1) and _VStop then dat else _nan;
    } else {
        _V = if _BN > lbL and dat == Lowest(dat, lbL + 1) and _VStop then dat else _nan;
    }
    plot result = if !IsNaN(_V) and _VStop then _V else _nan;
}
#-- Res
def PivotHigh = findpivots(h, 1, Bars, Bars);
def max = Max(c , o);

def HighAtPivot =  if !IsNaN(PivotHigh) then h else HighAtPivot[1];
def UpperAtPivot = if !IsNaN(PivotHigh) then max else UpperAtPivot[1];

def HighAtPivot1 = if HighAtPivot != HighAtPivot[1] then HighAtPivot[1] else HighAtPivot1[1];
def UpperAtPivot1 = if UpperAtPivot != UpperAtPivot[1] then UpperAtPivot[1] else UpperAtPivot1[1];

def HighAtPivot2 = if HighAtPivot1 != HighAtPivot1[1] then HighAtPivot1[1] else HighAtPivot2[1];
def UpperAtPivot2 =  if UpperAtPivot1 != UpperAtPivot1[1] then UpperAtPivot1[1] else UpperAtPivot2[1];

def HighAtPivot3 = if HighAtPivot2 != HighAtPivot2[1] then HighAtPivot2[1] else HighAtPivot3[1];
def UpperAtPivot3 = if UpperAtPivot2 != UpperAtPivot2[1] then UpperAtPivot2[1] else UpperAtPivot3[1];

def l1;
def l2;
if !IsNaN(PivotHigh) {
    if NoOfPivots == 2 and HighAtPivot < HighAtPivot1 and HighAtPivot > UpperAtPivot1 {
        l1 = HighAtPivot1;
        l2 = UpperAtPivot1;
    } else
    if NoOfPivots == 3 and HighAtPivot < HighAtPivot2 and HighAtPivot > UpperAtPivot2 and HighAtPivot1 < HighAtPivot2 and HighAtPivot1 > UpperAtPivot2 {
        l1 = HighAtPivot2;
        l2 = UpperAtPivot2;
    } else
    if NoOfPivots == 4 and HighAtPivot < HighAtPivot3 and HighAtPivot > UpperAtPivot3 and HighAtPivot1 < HighAtPivot3 and HighAtPivot1 > UpperAtPivot3 and HighAtPivot2 < HighAtPivot3 and HighAtPivot2 > UpperAtPivot3 {
        l1 = HighAtPivot3;
        l2 = UpperAtPivot3;
    } else {
        l1 = if extendLines then l1[1] else na;
        l2 = if extendLines then l2[1] else na;
    }
} else {
    l1 = l1[1];
    l2 = l2[1];
}

plot breakDn = if !IsNaN(PivotHigh) and PivotHigh > l2 and PivotHigh < l1 then l2 else na;
plot Line1 = if !last and l1 then l1 else na;
plot line2 = if !last and l2 then l2 else na;
def midL = (Line1 + Line2) / 2;
plot midLline = midL;
breakDn.SetPaintingStrategy(PaintingStrategy.SQUARES);
Line1.SetPaintingStrategy(PaintingStrategy.HORIZONTAL);
line2.SetPaintingStrategy(PaintingStrategy.HORIZONTAL);
midLline.SetPaintingStrategy(PaintingStrategy.HORIZONTAL);
breakDn.SetDefaultColor(Color.MAGENTA);
Line1.SetDefaultColor(GlobalColor("dn"));
line2.SetDefaultColor(GlobalColor("dn"));
midLline.SetDefaultColor(GlobalColor("dn"));

AddCloud(if Line1 == Line1[1] then Line1 else na, line2, Color.DARK_RED);
#-- Support
def PivotLow  = findpivots(l, -1, Bars, Bars);
def min =  Min(c , o);

def LowAtPivot   = if !IsNaN(PivotLow) then l else LowAtPivot[1];
def LowerAtPivot = if !IsNaN(PivotLow) then min else LowerAtPivot[1];

def LowAtPivot1   = if LowAtPivot != LowAtPivot[1] then LowAtPivot[1] else LowAtPivot1[1];
def LowerAtPivot1 = if LowerAtPivot != LowerAtPivot[1] then LowerAtPivot[1] else LowerAtPivot1[1];

def LowAtPivot2   = if LowAtPivot1 != LowAtPivot1[1] then LowAtPivot1[1] else LowAtPivot2[1];
def LowerAtPivot2 =  if LowerAtPivot1 != LowerAtPivot1[1] then LowerAtPivot1[1] else LowerAtPivot2[1];

def LowAtPivot3   = if LowAtPivot2 != LowAtPivot2[1] then LowAtPivot2[1] else LowAtPivot3[1];
def LowerAtPivot3 = if LowerAtPivot2 != LowerAtPivot2[1] then LowerAtPivot2[1] else LowerAtPivot3[1];
;

def l3;
def l4;

if !IsNaN(PivotLow) {
    if NoOfPivots == 2 and LowAtPivot >  LowAtPivot1 and LowAtPivot < LowerAtPivot1 {
        l4 = LowAtPivot1;
        l3 = LowerAtPivot1;
    } else
    if NoOfPivots == 3 and LowAtPivot > LowAtPivot2 and LowAtPivot < LowerAtPivot2 and LowAtPivot1 > LowAtPivot2 and LowAtPivot1 < LowerAtPivot2 {
        l4 = LowAtPivot2;
        l3 = LowerAtPivot2;
    } else
    if NoOfPivots == 4 and LowAtPivot > LowAtPivot3 and LowAtPivot < LowerAtPivot3 and LowAtPivot1 > LowAtPivot3 and LowAtPivot1 < LowerAtPivot3 and LowAtPivot2 > LowAtPivot3 and LowAtPivot2 < LowerAtPivot3 {
        l4 = LowAtPivot3;
        l3 = LowerAtPivot3;
    } else {
        l4 = if extendLines then l4[1] else na;
        l3 = if extendLines then l3[1] else na;
    }
} else {
    l4 = l4[1];
    l3 = l3[1];
}

plot breakUp = if !IsNaN(PivotLow) and PivotLow > l4 and PivotLow < l3 then l4 else na;
plot Line4 = if !last and l4 then l4 else na;
plot line3 = if !last and l3 then l3 else na;
def midH = (Line3 + Line4) / 2;
plot midHline = midH;
breakUp.SetPaintingStrategy(PaintingStrategy.SQUARES);
Line4.SetPaintingStrategy(PaintingStrategy.HORIZONTAL);
line3.SetPaintingStrategy(PaintingStrategy.HORIZONTAL);
midHline.SetPaintingStrategy(PaintingStrategy.HORIZONTAL);
breakUp.SetDefaultColor(Color.CYAN);
Line4.SetDefaultColor(GlobalColor("up"));
line3.SetDefaultColor(GlobalColor("up"));
midHline.SetDefaultColor(GlobalColor("up"));

AddCloud(if line3 == line3[1] then line3 else na,  Line4,  GlobalColor("up"));

#-- END of CODE