Avoid MACD False Crosses

Piper2808t

Member
2019 Donor
VIP
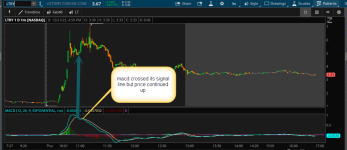
Is it possible to make the macd indicator avoid a false cross of its signal line i tried many divergence indicators with no luck. Pic will explain
 

Attachments

  • 12-21-2023 6-10-43 PM.png
    12-21-2023 6-10-43 PM.png
    60.2 KB · Views: 186
Most indicators do not adapt to the changing swing cycle length or magnitude. Risk management including cutting your losses short is the key. If you find an indicator that adapts to osculating and trending markets, you will be rich. The market naturally does what most people don't expect at any given time.
 

Join useThinkScript to post your question to a community of 21,000+ developers and traders.

Personal Opinion here:

You could:

1) slow down your MACD using 33,100,13, often referred to as a "slow MACD" (or a host of other possibilities).

or

2) consider adapting your MACD to a longer timeframe. Shorter timeframes like this present the "noise" you're experiencing.

What you're illustrating here is a combination of divergence and the math of the MACD itself.

I have come to accept the formation you're illustrating to be referred to personally as a "MACD ramp". It happens a fair bit and is worth paying attention to.

In the code below, I've set up a MACD with a switch. I was in a group with some people who had their own settings they had discovered and also, I wanted to switch the MACD settings faster.

You can copy the code of the MACD you're working with into a new indicator script and set up inputs for your levels to mess around and see what works for you.

This script also has a set of labels that give you an indication of whether the MACD is bullish or bearish along with showing you the last 5 periods.

Another tactic I've looked at with some success is adjusting the MACD to calculate based on highs and lows vs. just the close. I've never tried this, but, if you do stay with close, try setting it one bar back by adding [1]. Since "close" varies during a bar, the idea of "locking down" the MACD to the previous and complete close of the last bar could bring some clarity. Again, I've never tried it with MACD, but, I have done it with success.

Code:
declare lower;

def data = close;
input MACD_type = {default SLOW, "FAST", TekMuNNee, Neo};
input averagetype = averageType.EXPONENTIAL;
input ShowNOWLabels = yes;
input ShowHOWLONGLabel = yes;
def fastlength;
def slowlength;
def MACDlength;

 
switch (MACD_Type) {
case SLOW:
    fastlength = 33;
    slowlength = 100;
    MACDlength = 13;
    
case FAST:
    fastlength = 12;
    slowlength = 26;
    MACDlength = 9;

case TekMunNee:
    fastlength = 5;
    slowlength = 9;
    MACDlength = 5;

case Neo:
    Fastlength = 5;
    slowlength = 8;
    MACDLength = 5;
}

def fastMacd = fastlength == 12 and slowlength == 26 and macdlength == 9;
def slowmacd = fastlength == 33 and slowlength == 100 and macdlength == 13;
def TekMuNNeeMACD = fastlength == 5 and slowlength == 9 and macdlength == 5;

def NeoMacd = fastlength == 5 and slowlength == 8 and macdlength == 5;

AddLabel(1,if slowmacd then "Slow MACD" else if fastmacd then "Fast MACD" else if tekmunneemacd then "TekMuNNee" else if NeoMacd then "MyNameIsNEO" else "AddOption", Color.YELLOW);
 
plot Value = MACD(fastLength, slowLength, MACDLength, averagetype).value;
plot Avg = MACD(fastLength, slowLength, MACDLength, averageType).Avg;
plot ZeroLine = 0;

value.setdefaultcolor(color.cyan);
avg.setdefaultcolor(color.yellow);
zeroline.setdefaultcolor(color.white);

def valueavg = average((value),14);
def valuehigh = highestall(valueavg);
#Addlabel(1,valuehigh,color.cyan);

 def bullish = value > avg;

addlabel(shownowlabels,if value is greater than avg then "BULL" else "BEAR",if bullish then color.green else color.red);

addlabel(ShowHOWLONGlabel,if value is greater than avg then "BULL1" else "BEAR1",if bullish then color.green else color.red);

addlabel(ShowHOWLONGlabel,if value[1] is greater than avg[1] then "BULL2" else "BEAR2",if bullish[1] then color.green else color.red);

addlabel(ShowHOWLONGlabel,if value[2] is greater than avg[2] then "BULL3" else "BEAR3",if bullish[2] then color.green else color.red);

addlabel(ShowHOWLONGlabel,if value[3] is greater than avg[3] then "BULL4" else "BEAR4",if bullish[3] then color.green else color.red);

addlabel(ShowHOWLONGlabel,if value[4] is greater than avg[4] then "BULL5" else "BEAR5",if bullish[4] then color.green else color.red);
 
Personal Opinion here:

You could:

1) slow down your MACD using 33,100,13, often referred to as a "slow MACD" (or a host of other possibilities).

or

2) consider adapting your MACD to a longer timeframe. Shorter timeframes like this present the "noise" you're experiencing.

What you're illustrating here is a combination of divergence and the math of the MACD itself.

I have come to accept the formation you're illustrating to be referred to personally as a "MACD ramp". It happens a fair bit and is worth paying attention to.

In the code below, I've set up a MACD with a switch. I was in a group with some people who had their own settings they had discovered and also, I wanted to switch the MACD settings faster.

You can copy the code of the MACD you're working with into a new indicator script and set up inputs for your levels to mess around and see what works for you.

This script also has a set of labels that give you an indication of whether the MACD is bullish or bearish along with showing you the last 5 periods.

Another tactic I've looked at with some success is adjusting the MACD to calculate based on highs and lows vs. just the close. I've never tried this, but, if you do stay with close, try setting it one bar back by adding [1]. Since "close" varies during a bar, the idea of "locking down" the MACD to the previous and complete close of the last bar could bring some clarity. Again, I've never tried it with MACD, but, I have done it with success.

Code:
declare lower;

def data = close;
input MACD_type = {default SLOW, "FAST", TekMuNNee, Neo};
input averagetype = averageType.EXPONENTIAL;
input ShowNOWLabels = yes;
input ShowHOWLONGLabel = yes;
def fastlength;
def slowlength;
def MACDlength;

 
switch (MACD_Type) {
case SLOW:
    fastlength = 33;
    slowlength = 100;
    MACDlength = 13;
   
case FAST:
    fastlength = 12;
    slowlength = 26;
    MACDlength = 9;

case TekMunNee:
    fastlength = 5;
    slowlength = 9;
    MACDlength = 5;

case Neo:
    Fastlength = 5;
    slowlength = 8;
    MACDLength = 5;
}

def fastMacd = fastlength == 12 and slowlength == 26 and macdlength == 9;
def slowmacd = fastlength == 33 and slowlength == 100 and macdlength == 13;
def TekMuNNeeMACD = fastlength == 5 and slowlength == 9 and macdlength == 5;

def NeoMacd = fastlength == 5 and slowlength == 8 and macdlength == 5;

AddLabel(1,if slowmacd then "Slow MACD" else if fastmacd then "Fast MACD" else if tekmunneemacd then "TekMuNNee" else if NeoMacd then "MyNameIsNEO" else "AddOption", Color.YELLOW);
 
plot Value = MACD(fastLength, slowLength, MACDLength, averagetype).value;
plot Avg = MACD(fastLength, slowLength, MACDLength, averageType).Avg;
plot ZeroLine = 0;

value.setdefaultcolor(color.cyan);
avg.setdefaultcolor(color.yellow);
zeroline.setdefaultcolor(color.white);

def valueavg = average((value),14);
def valuehigh = highestall(valueavg);
#Addlabel(1,valuehigh,color.cyan);

 def bullish = value > avg;

addlabel(shownowlabels,if value is greater than avg then "BULL" else "BEAR",if bullish then color.green else color.red);

addlabel(ShowHOWLONGlabel,if value is greater than avg then "BULL1" else "BEAR1",if bullish then color.green else color.red);

addlabel(ShowHOWLONGlabel,if value[1] is greater than avg[1] then "BULL2" else "BEAR2",if bullish[1] then color.green else color.red);

addlabel(ShowHOWLONGlabel,if value[2] is greater than avg[2] then "BULL3" else "BEAR3",if bullish[2] then color.green else color.red);

addlabel(ShowHOWLONGlabel,if value[3] is greater than avg[3] then "BULL4" else "BEAR4",if bullish[3] then color.green else color.red);

addlabel(ShowHOWLONGlabel,if value[4] is greater than avg[4] then "BULL5" else "BEAR5",if bullish[4] then color.green else color.red);
wow thank you for this appreciate it
 

Similar threads

Not the exact question you're looking for?

Start a new thread and receive assistance from our community.

87k+ Posts
451 Online
Create Post

Similar threads

Similar threads

The Market Trading Game Changer

Join 2,500+ subscribers inside the useThinkScript VIP Membership Club
  • Exclusive indicators
  • Proven strategies & setups
  • Private Discord community
  • ‘Buy The Dip’ signal alerts
  • Exclusive members-only content
  • Add-ons and resources
  • 1 full year of unlimited support

Frequently Asked Questions

What is useThinkScript?

useThinkScript is the #1 community of stock market investors using indicators and other tools to power their trading strategies. Traders of all skill levels use our forums to learn about scripting and indicators, help each other, and discover new ways to gain an edge in the markets.

How do I get started?

We get it. Our forum can be intimidating, if not overwhelming. With thousands of topics, tens of thousands of posts, our community has created an incredibly deep knowledge base for stock traders. No one can ever exhaust every resource provided on our site.

If you are new, or just looking for guidance, here are some helpful links to get you started.

What are the benefits of VIP Membership?
VIP members get exclusive access to these proven and tested premium indicators: Buy the Dip, Advanced Market Moves 2.0, Take Profit, and Volatility Trading Range. In addition, VIP members get access to over 50 VIP-only custom indicators, add-ons, and strategies, private VIP-only forums, private Discord channel to discuss trades and strategies in real-time, customer support, trade alerts, and much more. Learn all about VIP membership here.
How can I access the premium indicators?
To access the premium indicators, which are plug and play ready, sign up for VIP membership here.
Back
Top